

Most SaaS startups never grow because customer leakage and weak expansion cancel out new acquisition before compounding can happen. If you’re trying to understand why SaaS startups fail to grow, the root problem is usually not “we need more leads,” it’s retention quality, ICP fit, and cash efficiency breaking at the same time.
In April, a founder named Elena showed me a dashboard with “good” top-line activity: 420 trial signups, 51 new paid accounts, and a growing ad budget. On paper, that looked like momentum. Underneath, month-2 churn was 16%, onboarding completion was 43%, and support tickets per account had doubled. New MRR was rising, but net new MRR was almost flat.
This is the pattern most teams miss. Early growth can hide structural leaks for months. Then growth suddenly “stalls,” fundraising gets harder, and the team assumes they need more pipeline. In reality, they need better compounding math.
In this guide, you’ll see the exact bottlenecks behind stalled SaaS growth, the metrics that surface them early, and a practical 90-day operating plan to restart durable growth without pretending you can outspend bad retention.
Key Takeaways
Most SaaS growth plateaus come from retention leakage, not just weak acquisition volume.
ICP mismatch creates fake traction: accounts close, but usage, expansion, and renewal quality stay weak.
SaaS can have high gross margins and still fail to scale if CAC payback drifts and services creep expands.
Cash timing kills growth before annual metrics look dangerous; runway compression often starts quietly.
A weekly scorecard across acquisition, retention, and cash is the fastest way to catch stall risk early.
Why SaaS startups fail to grow: retention failure disguised as acquisition pressure
The cleanest way to understand stalled SaaS growth is this:
Net New MRR = New MRR + Expansion MRR - Churned MRR - Contraction MRR

Founders obsess over the first term and under-manage the rest. That works for a short window, especially after launch or a new campaign. It fails as soon as acquisition costs rise or product novelty fades.
Why new MRR hides churn leakage
Suppose you add $40,000 in new MRR this quarter. That sounds strong. But if you lose $18,000 to churn and $9,000 to downgrades, and expansion only adds $6,000, your net new MRR is $19,000, less than half the headline number. One pricing mistake or channel decay can erase it.
This is exactly why teams with “great top-of-funnel” still report flat growth after six to nine months. They’re filling a leaking bucket faster, not fixing the leak.
Data from CB Insights supports the broader failure pattern: startups most often fail due to lack of market need (35%) and running out of cash (38%). In SaaS, those usually show up first as retention weakness and unit economics stress.
Why “more leads” does not fix weak activation and onboarding
If activation is weak, acquisition amplifies waste.
A common sequence:
You increase ad spend.
Trial signups rise.
Activation rate stays flat.
Low-fit users churn fast.
CAC payback stretches.
Team asks for more leads again.
That cycle feels like growth work, but it’s actually churn financing.
Before scaling any channel, force one hard check: Are your best-fit users reaching first value quickly and staying active by week 4 and week 8? If the answer is no, growth spend is usually premature.
How ICP mismatch creates fake traction
You can hit demo targets and still be miles from durable growth if your ICP is too broad. SaaS teams often treat “closed-won” as proof of fit. It isn’t. It’s only proof of initial buying intent.
Signs you’re acquiring the wrong customers
Watch for this cluster:
Fast trial-to-paid conversion, but weak month-2 and month-3 retention
High onboarding hand-holding per account
Expansion concentrated in a tiny subset of customers
Support burden growing faster than MRR
New logos coming from segments with low product depth usage
When these show up together, you don’t have a funnel problem. You have a fit problem.
Mini-story: Jordan ran a vertical SaaS for field-service teams. His team celebrated 28% trial-to-paid conversion, far above peers. But 70% of new accounts never integrated scheduling workflows in the first 30 days, and logo churn in the smallest segment hit 19% monthly. The “good conversion” segment was actually low urgency and price-sensitive. Once Jordan narrowed ICP to multi-crew companies and rebuilt onboarding around dispatch setup, retention improved before acquisition volume did.
Expansion vs. support burden tradeoff
Bad-fit customers are expensive twice:
They churn early.
They consume support and customization effort while they’re active.
That second cost is where many SaaS startups quietly lose operating use.
If expansion MRR is low but support hours per account are rising, you’re likely subsidizing low-fit revenue. A cleaner path is to tighten ICP, standardize onboarding, and reprice support-heavy tiers so the economics match the workload.
If you want an industry-specific baseline, start with the SaaS tools hub and compare your assumptions against your actual workflow and segment mix.
Why SaaS startups fail to grow even with strong gross margins
Many founders assume high gross margin guarantees scale. It doesn’t. It gives you potential operating use, not automatic growth.
Stripe’s SaaS gross margin guide notes that 75%+ gross margin is often considered healthy, with top performers reaching 80%+. Cross-industry data from NYU Stern (Damodaran) shows Software (System & Application) at roughly 71.72% gross margin and 25.49% net margin. Those are strong economics relative to many sectors, but they don’t prevent growth stalls.
Sales efficiency decay (CAC payback drift)
You can look profitable on paper and still be non-scalable if CAC payback keeps drifting out.
A rough warning pattern:
Month 1-3: CAC payback around 9-12 months
Month 4-8: channel saturation and weaker fit push it to 14-18 months
Month 9+: growth slows, cash pressure rises, team cuts experiments too late
If payback worsens while retention is flat or down, the growth engine is decaying. This is one reason operators track CAC, LTV, and retention together, not separately.
Services creep and support-cost sprawl
Early SaaS teams often add implementation or custom work to close deals. Done carefully, this can help. Done reactively, it becomes margin drag and product distraction.
Mini-story: Farhan’s B2B workflow SaaS introduced a “temporary” onboarding package to close enterprise pilots faster. Close rate improved for two quarters. Then delivery work consumed product and customer-success capacity, roadmap speed slowed, and core onboarding remained weak for self-serve customers. Gross margin on new business fell from 81% to 64%, and expansion lagged because adoption quality didn’t improve.
The lesson isn’t “never add services.” It’s “price them honestly, scope them tightly, and track whether they improve long-term retention.”
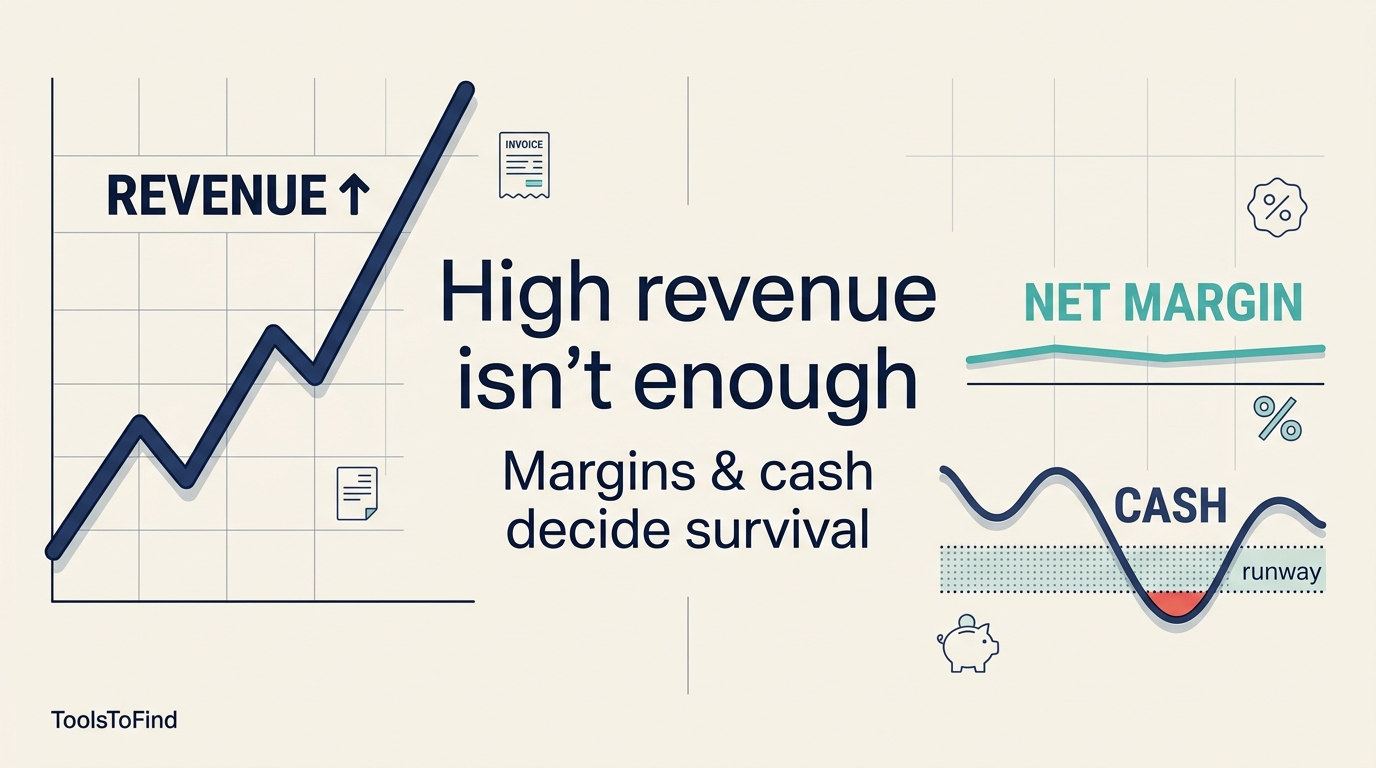
Cash conversion lag and runway compression
Revenue growth does not equal cash safety. You can grow bookings while cash gets tighter due to:
Longer sales cycles
Higher commission draw
Upfront onboarding costs
Delayed collections
Rising support headcount ahead of realized expansion
This is where many teams misread the situation as “temporary burn.” In practice, it’s often a structural timing issue that compounds.
If this sounds familiar, review your operating rhythm against working capital under growth pressure before adding budget to acquisition.
The metrics that predict stalled growth early
If you only track new MRR, you’ll spot problems late. You need one scorecard that combines acquisition, retention, and cash quality.
The practical founder scorecard
Metric Group | What to Track Weekly | Stall Signal |
|---|---|---|
Acquisition | CAC by channel, trial-to-paid, sales cycle length | Rising CAC + flat conversion quality |
Retention | Logo churn, gross revenue churn, NRR, expansion MRR | NRR below sustainability target, expansion concentrated in few accounts |
Product Value | Activation rate, time-to-first-value, week-4 active users | Strong top funnel but weak activation continuity |
Margin Quality | Gross margin trend, support cost per account, services ratio | Margin compression during “growth” |
Cash & Efficiency | CAC payback, burn multiple, runway months | Payback drift + shrinking runway |

A monthly snapshot is not enough. Track 4-quarter trends to separate noise from a real structural leak.
NRR, churn, and expansion: the retention triangle
For SaaS, net revenue retention (NRR) is one of the clearest compounding signals. High acquisition can mask low NRR for a while, but only for a while. If expansion doesn’t offset churn and contraction, your growth curve flattens.
Use this sequence in order:
Improve activation and onboarding quality.
Reduce early-life churn in your best-fit segment.
Build expansion motions after usage depth is real.
Skipping step 1 is where most “upsell strategies” fail.
4-quarter view beats single-month noise
A single month can look great because of one enterprise close. A 4-quarter line tells you if your system is improving.
Track trend lines for:
New MRR
Churned + contracted MRR
Expansion MRR
Net new MRR
Gross margin %
CAC payback
If net new MRR grows while gross margin and payback worsen, you’re buying growth quality with future pain.
For a deep metric framework, David Skok’s classic SaaS Metrics 2.0 is still useful. For benchmark context by stage, see High Alpha SaaS Benchmarks.
YouTube walkthrough (for your team sync)
Use this in your next weekly review to align product, growth, and finance on the same retention-first model: YouTube results: SaaS retention and growth metrics walkthrough
Contextual CTA: If you want a fast baseline before your next planning meeting, run a SaaS margin benchmark check and compare scenarios with your current retention assumptions.
90-day founder plan to restart compounding growth
You do not need a 12-month transformation deck to fix stalled growth. You need a focused quarter with hard tradeoffs.
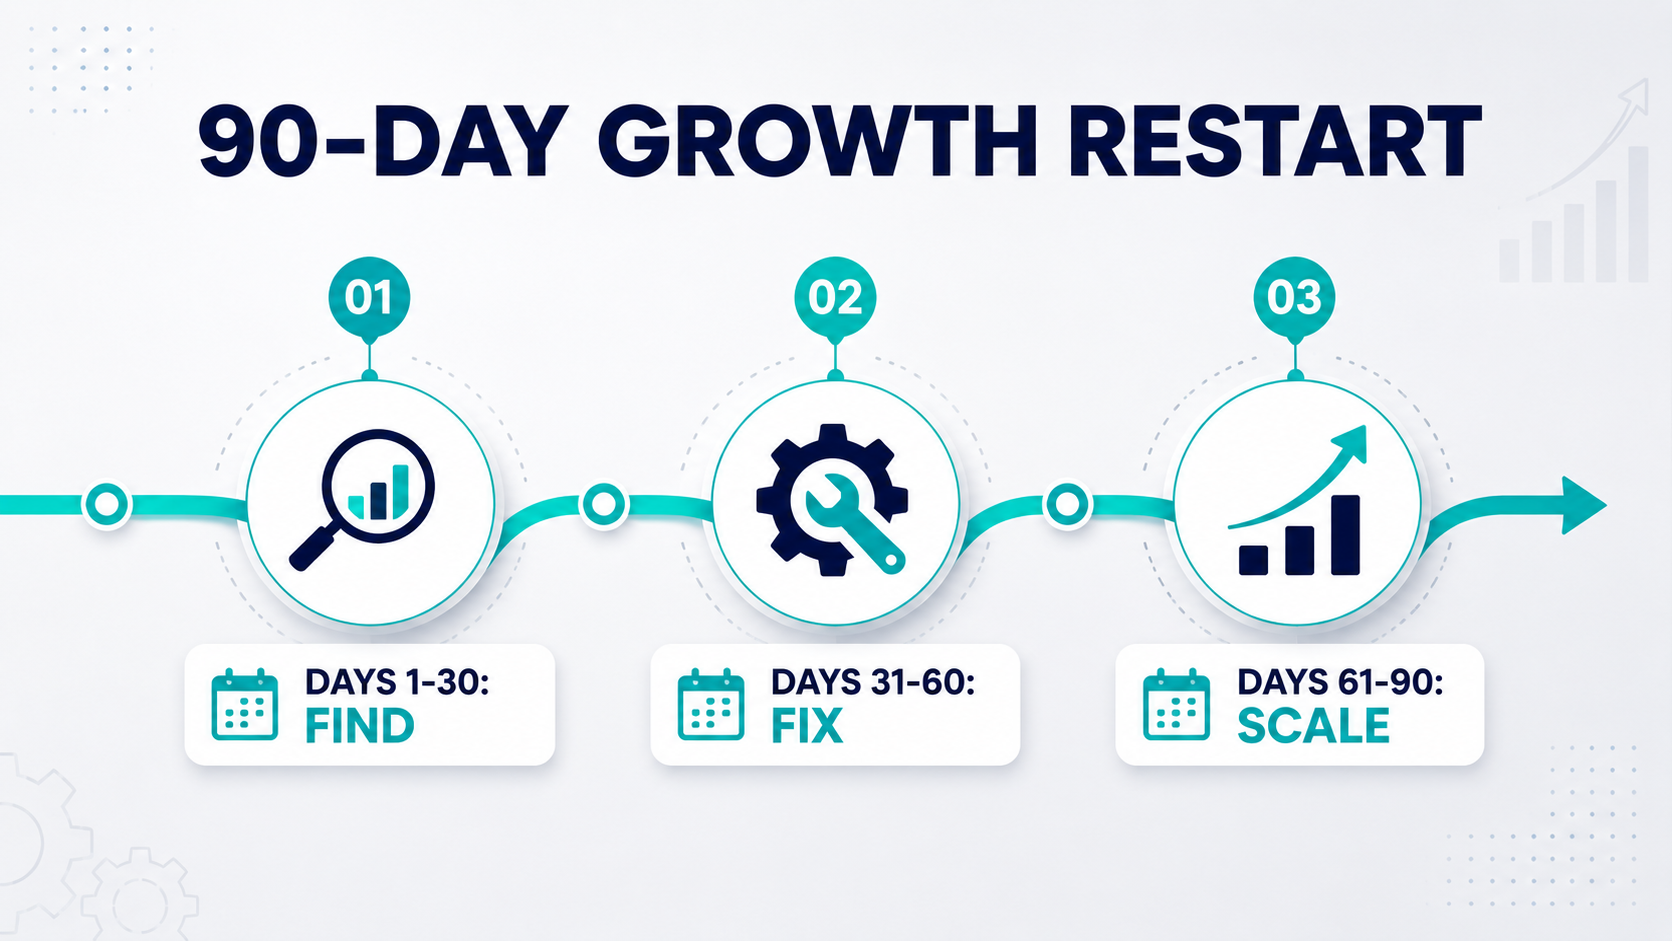
Days 1-30: Find the leak by segment, not by average
Segment customers by ICP quality (best fit, acceptable fit, low fit)
Measure activation and retention by segment
Map support load per segment
Separate expansion from pure new logo growth
Freeze broad channel scaling until this view is clear
Output by day 30: one-page leak map with top 3 growth blockers.
Days 31-60: Fix activation and pricing where economics break
Rebuild onboarding around one fast “first value” moment
Remove low-value setup steps that delay activation
Reprice support-heavy segments (or narrow eligibility)
Tighten plan packaging so expansion follows real usage
Add retention-focused lifecycle messaging in first 60 days
This is where “professional output without a big invoice” matters. You can model pricing changes quickly, then pressure-test downside scenarios before rollout. If needed, use gross margin vs. markup guidance to avoid pricing math errors during packaging changes.
Days 61-90: Reallocate spend to what compounds
Shift budget from weak channels to high-retention segments
Build one repeatable expansion motion (seat growth, usage tier, module add-on)
Set channel guardrails: no scale unless payback and retention thresholds hold
Review weekly with one shared dashboard across product, growth, and finance
Mini-story: Priya’s compliance SaaS looked healthy at 11% monthly MRR growth, but NRR sat at 92 and payback had slipped to 16 months. Over one quarter, she cut two low-fit paid channels, simplified onboarding to reduce time-to-first-value from 12 days to 4, and introduced a higher-priced managed tier for support-heavy customers. By quarter end, NRR moved to 104, payback improved to 10 months, and net new MRR became less volatile. Growth restarted without a bigger ad budget.
Contextual CTA: Before your next spend increase, model ROI for your SaaS growth bets and save your scenarios so your team can compare options from one workspace.
FAQ: The questions founders ask when growth stalls
Why do SaaS startups grow early, then plateau?
They often plateau because early acquisition momentum masks retention and activation problems. Once channel efficiency drops or competition rises, those hidden leaks become visible and net growth flattens.
What matters more: growth rate or retention?
Retention quality usually matters more for durability. Growth rate is a snapshot; retention determines whether growth compounds or resets every month.
Can a SaaS startup have strong revenue and still fail?
Yes. Strong revenue can coexist with weak cash timing, margin compression, or poor payback. That’s one reason CB Insights lists cash failure as a top shutdown cause even when companies had traction.
Is high gross margin enough to prove a healthy SaaS model?
No. High gross margin is necessary but not sufficient. You still need healthy retention, expansion, and payback dynamics for scalable growth.
What should we fix first if we’re stuck at the same MRR?
Start with early-life retention in your best-fit segment. Fix onboarding and activation before adding acquisition spend. Then reprice or de-prioritize support-heavy low-fit segments.
Do we need a full finance team to run this analysis?
No. You need consistent definitions and one shared scorecard. Start simple, then add depth as your data quality improves.
Conclusion: Growth is a retention and economics system, not a lead volume contest
Most SaaS startups never grow because they try to scale acquisition on top of unresolved retention leaks and fragile unit economics. The real fix is operational, not motivational: tighten ICP, improve activation, protect margin quality, and manage cash timing before you scale spend.
If your team is deciding where to put the next 90 days, run your numbers first and align on one dashboard. Start with:
When the math is clear, growth decisions get faster, cleaner, and much harder to regret.
Priority calculators
Use the calculator pages that support this topic
These direct utility pages add the industry-specific calculator and methodology context most likely to help while you read the article.
SaaS ROI
See our SaaS ROI Calculator for subscription growth decisions
Model CAC payback, retention, gross margin, and expansion assumptions before increasing growth spend.
Open calculatorSaaS margin
Use our SaaS Profit Margin Calculator to check unit economics
Pressure-test gross margin, support burden, and delivery costs before treating recurring revenue as healthy.
Open calculatorSaaS planning
Draft a SaaS business plan with subscription-specific assumptions
Turn revenue model, market, product, and cash assumptions into a structured planning draft.
Open calculatorStay in the loop
Get product updates and editorial highlights. Manage email preferences in your account settings.
Sign in for freeMore articles

SaaS
SaaS SEO in 2026: How to Rank a SaaS Website in Google and AI Search
Learn SaaS SEO in 2026: rank a SaaS website in Google and AI search with technical fixes, intent-led content, and GEO tactics. Get the checklist.

SaaS
The Rise of Agentic SaaS: A Founder's Guide to Autonomous Operations
Move beyond chatbots. Learn how Agentic SaaS is changing unit economics, profit margins, and planning for founders. Discover the ROI of autonomous AI agents.

SaaS
Why SaaS Businesses Have Higher Profit Margins Than Traditional Industries
Learn why SaaS businesses often post higher margins than retail, transport, and other sectors, and how to benchmark your margin model with real data.

Finance
Profit Margin Insights Every Entrepreneur Must Know to Build a Sustainable Business
What is a good profit margin for a small business? Learn industry-aware benchmarks and practical pricing and cost moves to build sustainable profit.

Strategy
How to Identify High-Margin Products & Eliminate Low Profit
Stop chasing revenue that doesn't pay. Learn how to identify high-margin products, calculate contribution margin, and prune unprofitable services in 2026.
Pricing
Calculate Your Business Profit Margin Instantly with Industry-Specific Insights
Calculate your business profit margin instantly. Compare your gross and net margins against industry benchmarks for SaaS, Retail, Consulting, and more.
Finance
Why Businesses Fail With High Revenue: Margins and Cash Matter More Than Sales
Why businesses fail despite high revenue: the hidden role of profit margins
SaaS
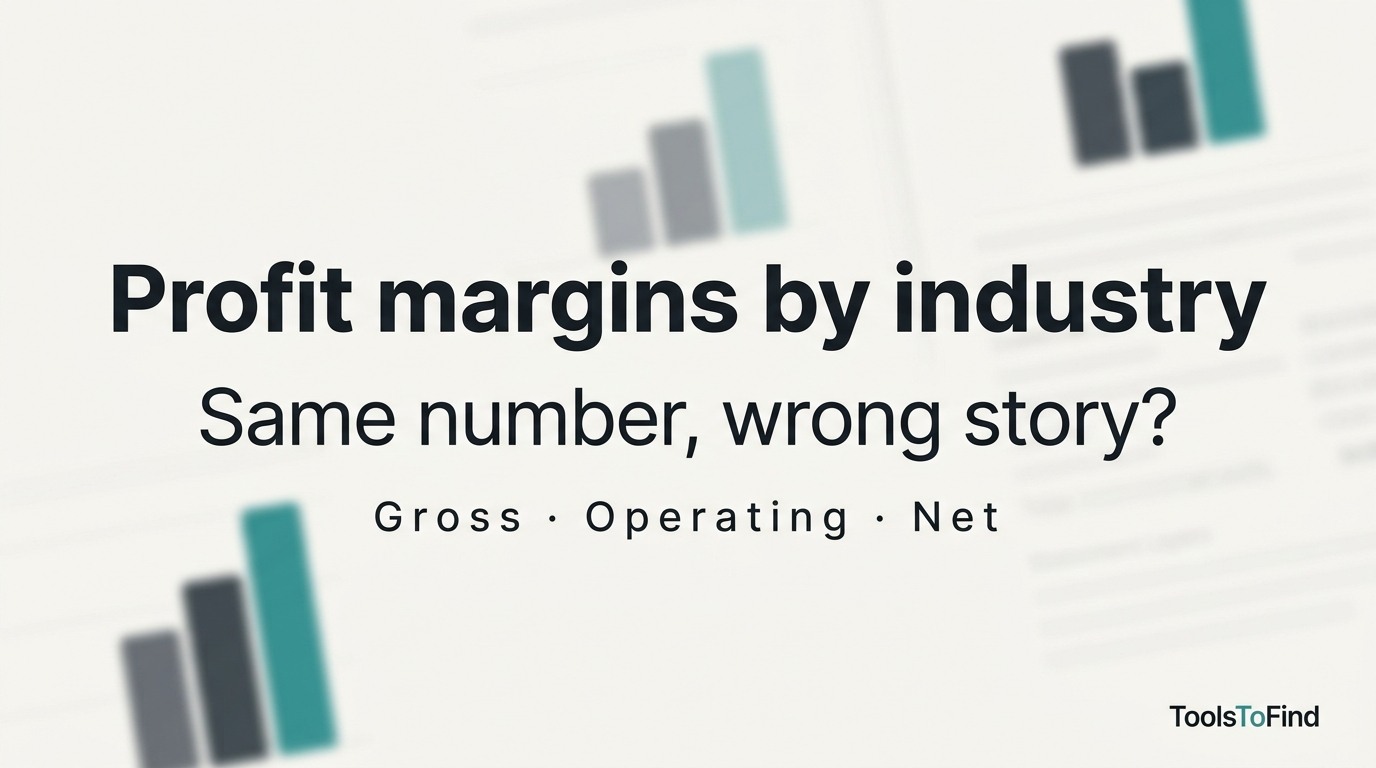
Profit Margin Benchmarks by Industry: SaaS, Retail, Healthcare & More
Compare industry profit margin benchmarks for SaaS, retail, and healthcare. Gross vs net, correct peer groups, then run free margin math on ToolsToFind.
Construction
Payroll Calculator for Restaurants: Loaded Cost vs Salary for Your First Hire
Use a payroll calculator for restaurants to estimate loaded labor cost, not just salary, before your first hire in a 5-person team.

Operations
Break-Even Analysis for Service Businesses
Use break-even analysis to set minimum pricing, workload targets, and hiring timing before growth creates operating strain.

HR
First-Hire Payroll Mistakes to Avoid
Model the full cost of a first employee before you hire so payroll taxes, setup work, and role design do not surprise the business.

Finance
Invoice Follow-Up System for Faster Payments
A useful invoice follow-up process reduces days sales outstanding without turning collections into a messy manual scramble.

Hospitality
Restaurant Labor Cost Benchmarks
Restaurant labor targets only help when they are tied to service model, scheduling realities, and how the team actually staffs peak periods.

Manufacturing
Manufacturing Unit Economics Basics
Unit economics in manufacturing start with cost structure, throughput, and margin discipline, not just with revenue per order.

Operations
Working Capital Planning for Growth
Growth often tightens liquidity before it improves it, which is why working-capital planning matters most when the business is expanding.
Pricing
Gross Margin vs Markup for Pricing Decisions
Gross margin and markup are related but not interchangeable, and mixing them up is one of the easiest ways to underprice work.

Operations
Capital Budgeting for Small-Business Equipment Purchases
Equipment decisions need more than a lease quote and a productivity hunch. Capital budgeting helps test whether the purchase actually improves the business.

Operations
Capacity Planning for Professional Services Teams
Capacity planning in professional services is not only a staffing exercise. It shapes pricing, delivery quality, and which work the firm should accept.

Retail
Retail Seasonal Inventory Planning Without Overbuying
Seasonal inventory planning should balance sell-through, cash exposure, and markdown risk rather than pushing the business into one oversized bet.