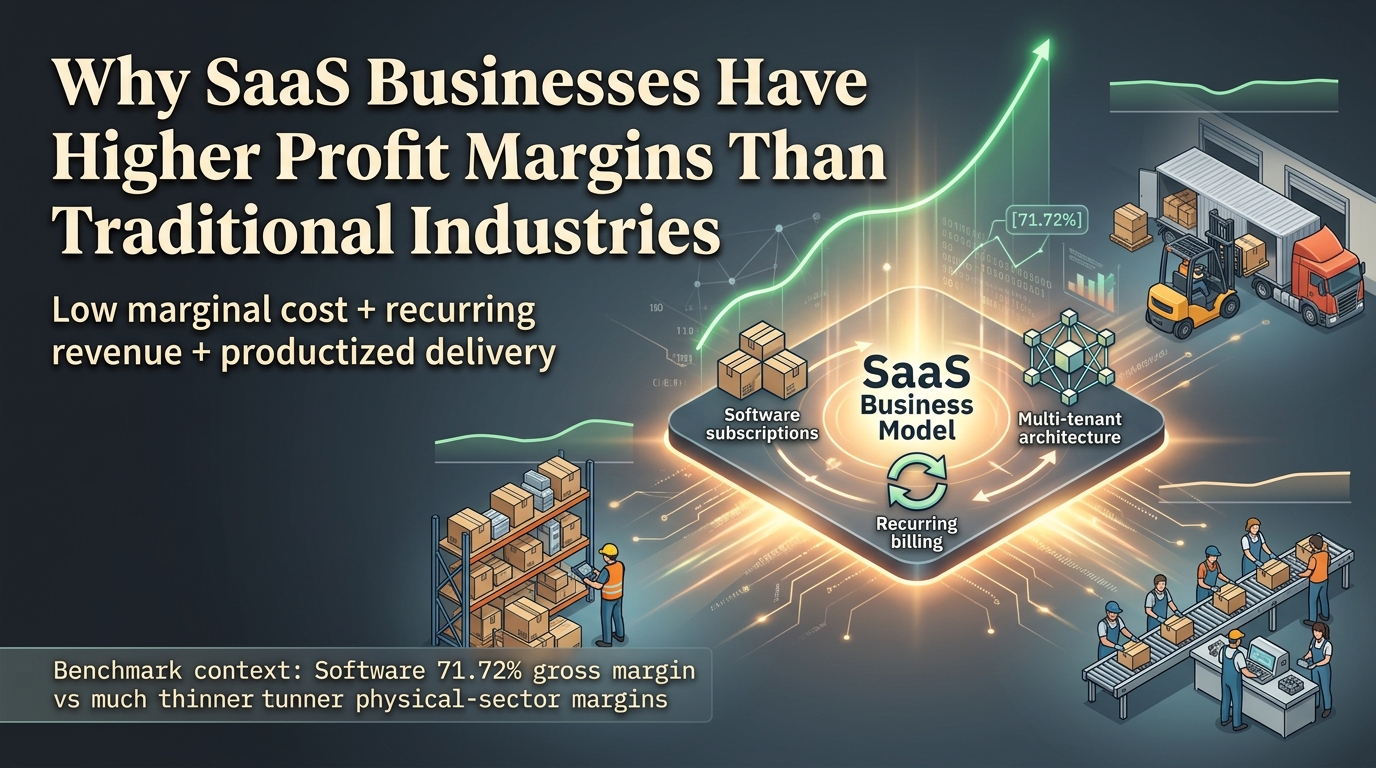
Why SaaS Busineses Have Higher Profit Margins Than Traditional Industries
SaaS businesses usually have higher profit margins than traditional industries because once the product is built, the cost to serve each additional customer is often low compared with physical-goods or labor-heavy businesses. Put simply, SaaS profit margin is often higher when recurring revenue, multi-tenant delivery, and productized onboarding work together.
Priya founded a B2B SaaS tool for customer onboarding in 2023. By late 2025, she had crossed $2.1M in annual recurring revenue with a small team and no field sales force. Around the same time, her friend Marcus scaled a regional wholesale operation to similar annual revenue. Priya's gross margin stayed above 75 percent; Marcus fought freight shifts, returns, and inventory carrying costs that pushed his margin down into the 20s. Both grew. Only one model had enough margin room to make growth feel easier each quarter.
If you have ever looked at SaaS and wondered why software companies can reinvest faster than many traditional operators, this guide breaks it down without hype. You will see the structural reasons margins diverge, where founders misread the numbers, and how to benchmark your own business against realistic ranges before you change price, hiring, or spend.
Key Takeaways
SaaS margin strength is mostly economic structure, not magic: low incremental delivery cost plus recurring contracts create better operating upside in many cases.
Stripe's benchmark guidance commonly cited by operators puts strong SaaS gross margin above 75 percent, with top performers often at 80 percent or more.
NYU Stern industry data shows Software (System and Application) at 71.72 percent gross margin and 25.49 percent net margin, while Retail (Grocery and Food) is 26.31 percent gross and 1.32 percent net.
High SaaS gross margin does not guarantee high net margin if acquisition cost, cloud waste, and support overhead are unmanaged.
You get better decisions when you pair margin percentages with industry context, not generic "small business averages."
If you want to compare your own numbers quickly, start with the profit margin calculators, pick your sector, and run gross and net scenarios before your next planning meeting.
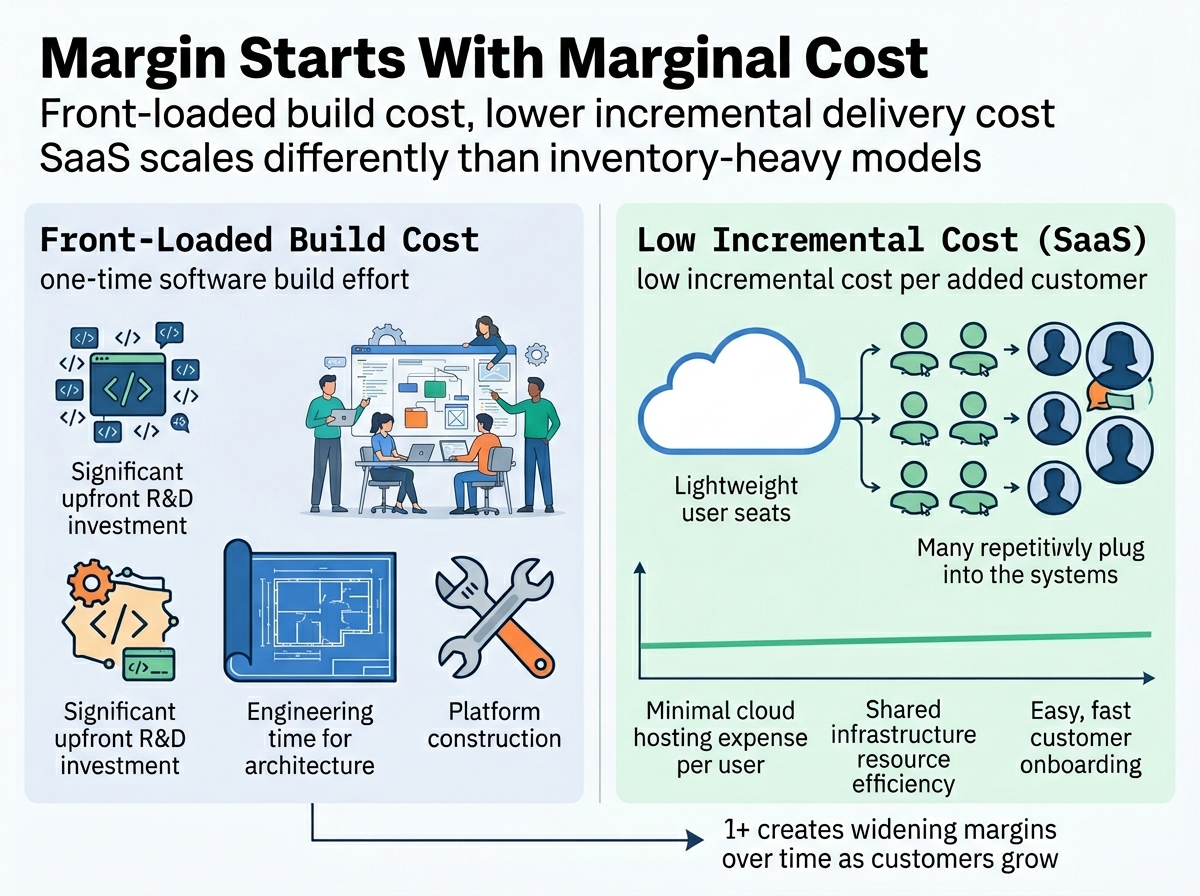
SaaS profit margin starts with marginal cost, not just top-line growth
Most margin conversations begin with a percentage and stop there. The more useful way to think about SaaS profit margin is to start with how costs behave as revenue grows.
In many SaaS models, a large share of product cost is front-loaded: engineering, architecture, and platform setup happen before meaningful scale. After launch, each additional customer can be served through the same codebase and infrastructure footprint until usage crosses a threshold. The incremental cost does rise over time, but usually not in a one-to-one relationship with revenue.
Traditional industries often have a different cost curve:
A manufacturer usually buys more material, shipping, and labor for each production increase.
A retailer usually takes more inventory risk and markdown exposure as sales targets rise.
A service firm may need to add billable labor nearly in line with delivery volume.
Transport-heavy businesses often absorb fuel, maintenance, and scheduling complexity that scale with throughput.
That difference is why two businesses can each grow 20 percent and still report very different margin outcomes.
A simple way to visualize the gap
Think of each extra dollar in revenue as a filter:
How much is consumed by direct delivery cost?
How much is consumed by sales and operating overhead?
How much survives to net income and cash?
SaaS often starts with a stronger first filter. Traditional sectors can still build excellent businesses, but they typically need tighter process discipline and stronger purchasing power to protect that first layer.
For a practical refresher on margin math mechanics, see gross margin vs markup for pricing decisions.
SaaS versus traditional industries: what the benchmark data shows
A clean comparison needs one source for all sectors. NYU Stern's industry margin dataset is useful because it reports comparable gross and net margin snapshots across industries.
Industry (NYU Stern) | Gross Margin | Net Margin |
|---|---|---|
Software (System and Application) | 71.72% | 25.49% |
Air Transport | 24.79% | 2.51% |
Retail (General) | 33.18% | 5.61% |
Retail (Grocery and Food) | 26.31% | 1.32% |
Auto and Truck | 10.41% | 1.29% |
Source: NYU Stern margin data
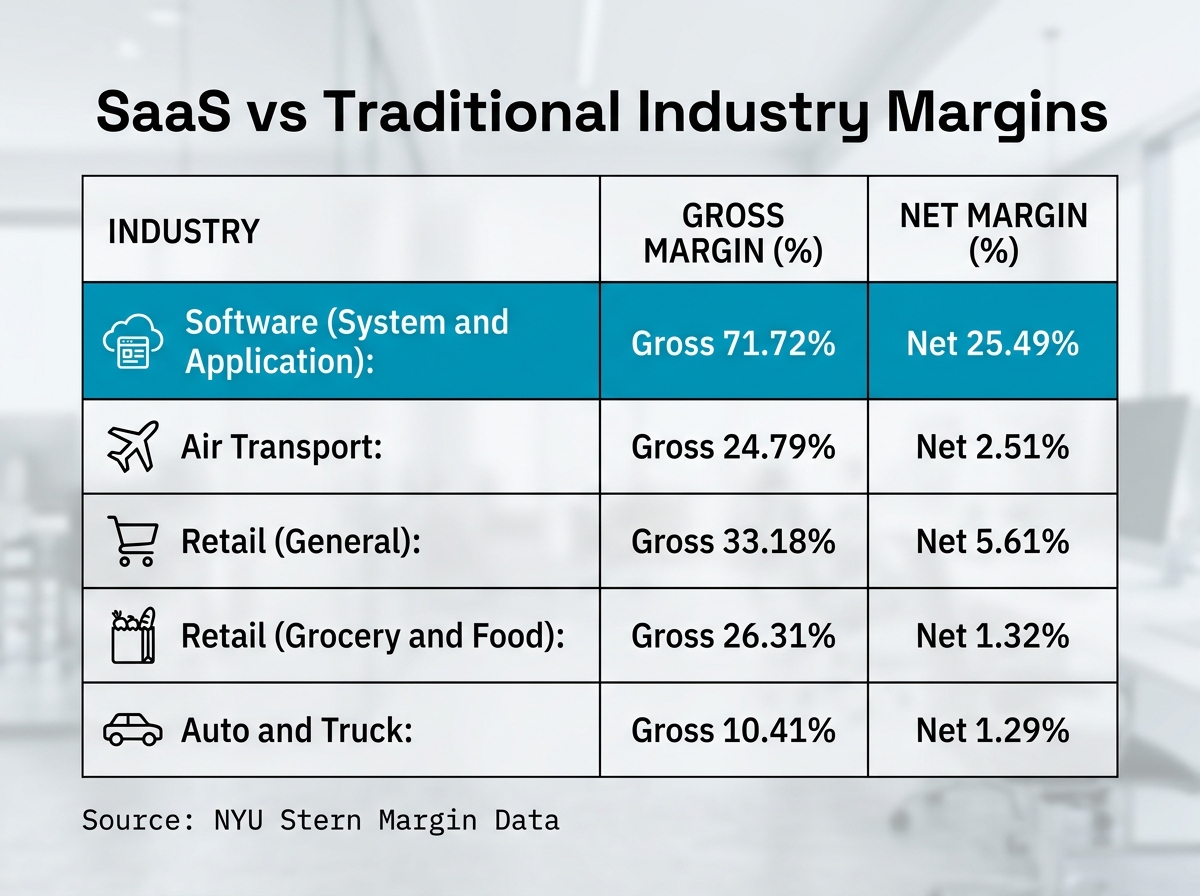
These numbers are not destiny for any one company, but they make the structural point clearly: many software businesses start from a much wider gross margin base than sectors that carry inventory, logistics, commodity input risk, or heavy physical operations.
Why investors keep coming back to SaaS margin quality
Investors do not like margin percentages for vanity reasons. They like what margins imply about resilience and reinvestment capacity.
From Stripe's SaaS gross margin guide:
gross margin above 75 percent is often considered healthy in SaaS,
top-performing SaaS companies frequently report 80 percent or higher gross margins.
Source: Stripe SaaS gross margin explainer
Capchase benchmark commentary also highlights that top quartile private SaaS companies commonly clear 80 percent gross margin in their sample set.
Source: Capchase gross margin benchmarks
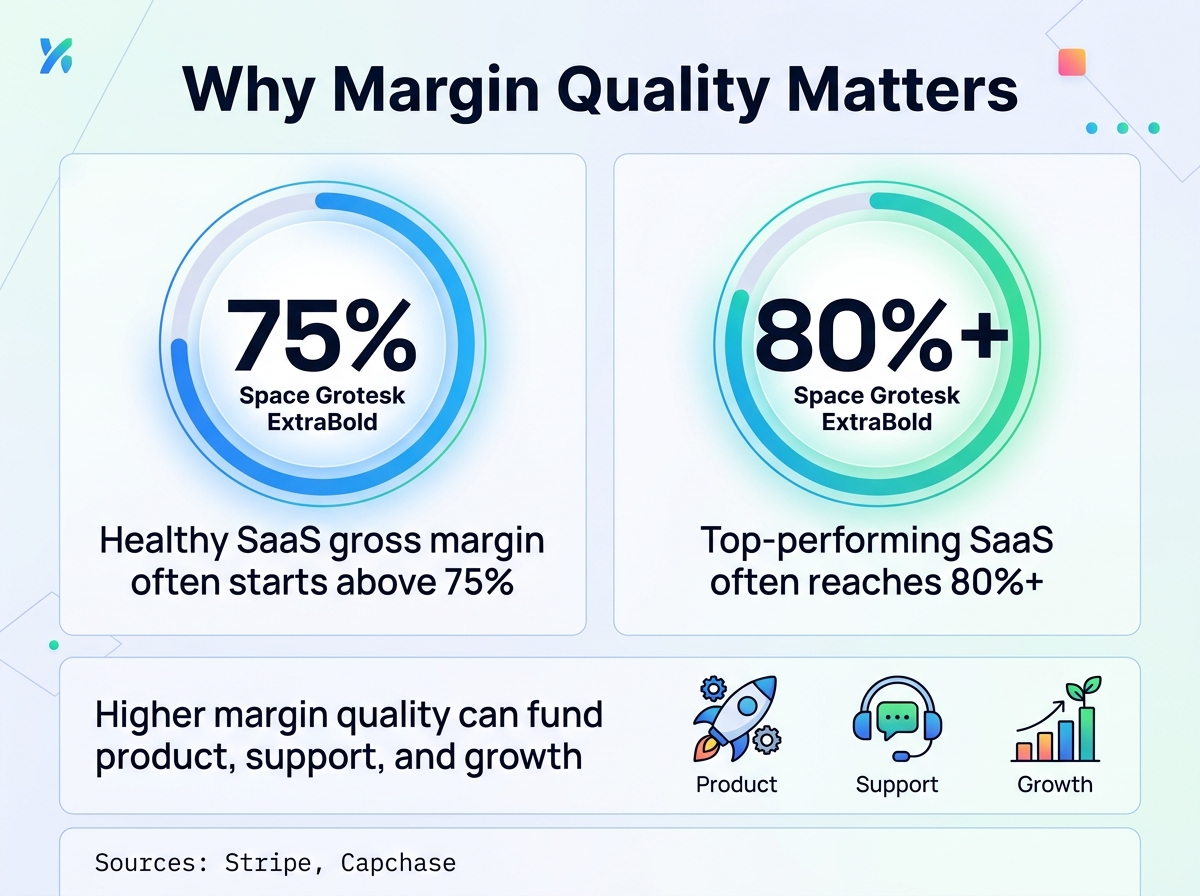
Those ranges matter because they define how much room a business has to fund product, support, acquisition, and experimentation without running into immediate margin compression.
Want a faster benchmark check against your own industry profile? Use the SaaS industry hub first, then run your own margin inputs in the calculator workflow.
Why recurring revenue and product delivery model widen SaaS margins
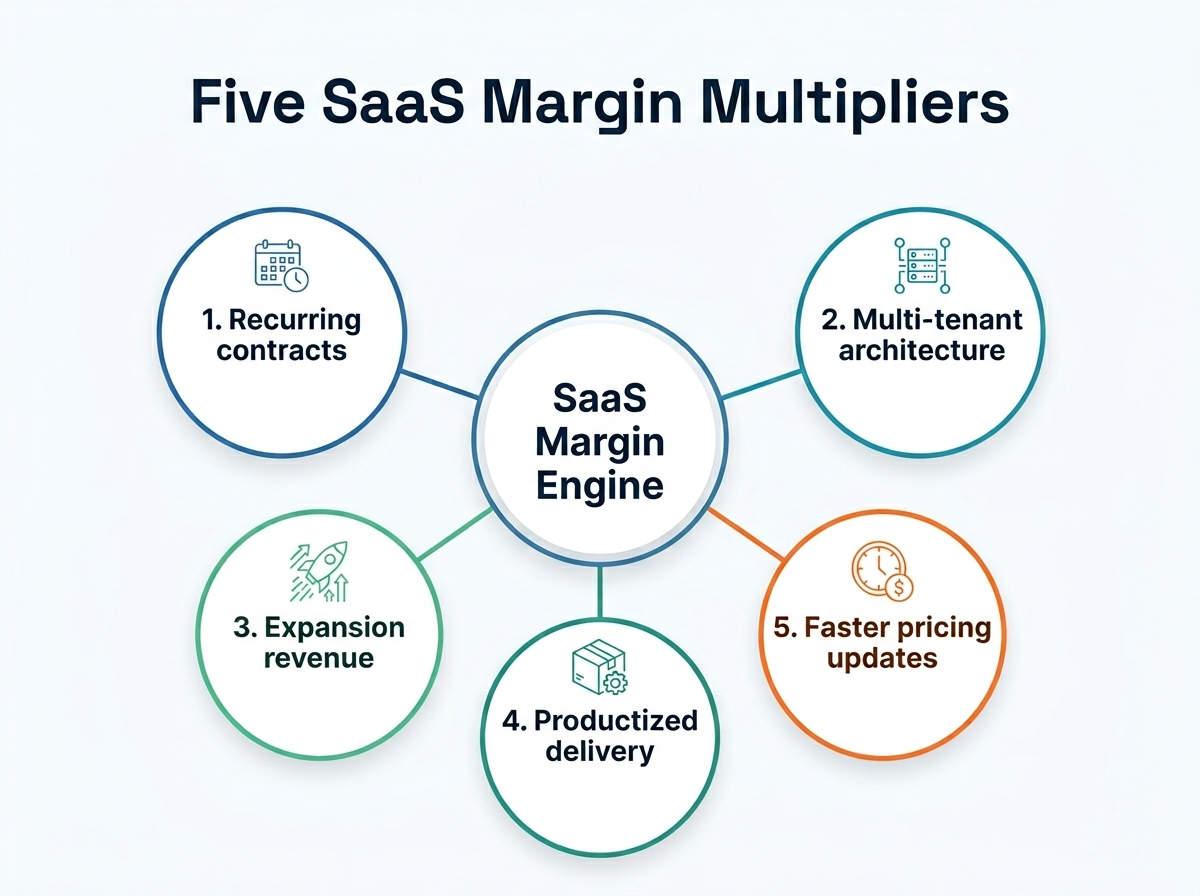
SaaS does not win on margin only because "software is digital." It wins when several business mechanics work together.
1. Recurring contracts reduce revenue volatility
Monthly or annual subscriptions improve forecast quality. When forecast quality improves, teams make steadier hiring, infrastructure, and spend decisions. That reduces panic decisions that often destroy margin in traditional seasonal or one-off sales models.
2. Multi-tenant architecture spreads fixed cost
In many products, one platform serves thousands of customers with shared underlying infrastructure. That lets cost scale in steps instead of linearly. You still pay more cloud and support as usage grows, but typically with better cost-per-customer behavior than one-to-one service delivery models.
3. Expansion revenue can outpace incremental COGS
When existing customers add seats, modules, or usage, revenue can grow faster than direct delivery cost if onboarding and support are controlled. This is one reason strong retention and expansion metrics usually correlate with stronger operating profiles.
4. Productization compresses labor variability
Traditional services often depend on custom work. SaaS can turn repeated customer needs into product features, templates, and flows. As repeatability increases, delivery cost per account often drops.
5. Price moves can be distributed quickly
SaaS pricing changes, packaging updates, and entitlement shifts can be rolled out centrally. Traditional sectors with complex channel contracts or physical relabeling often have a longer cycle from decision to realized margin impact.
Why some SaaS companies still show weak net margins
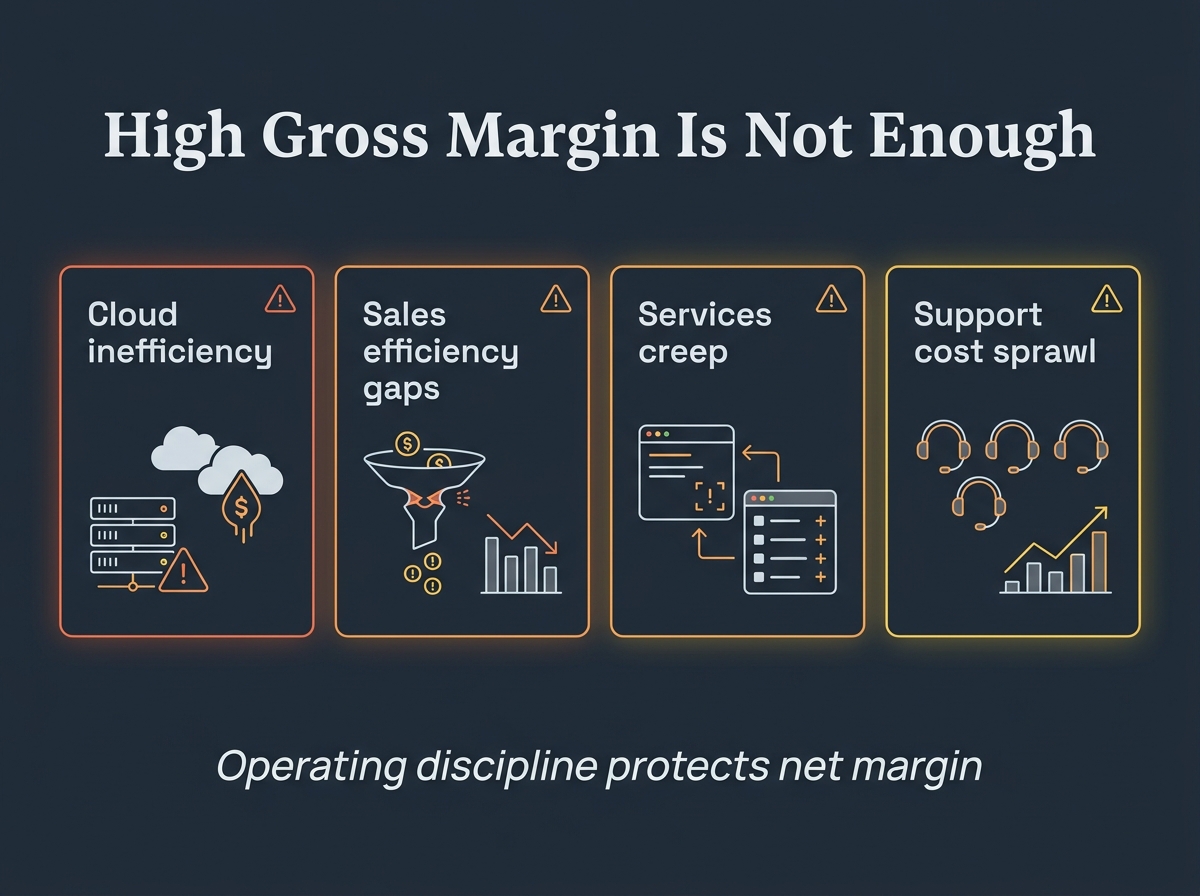
This is where many teams get surprised. High SaaS gross margin does not automatically create a strong net margin. Poor operating discipline can erase structural advantages quickly.
Cloud inefficiency and architecture drift
A team can "buy growth" with overprovisioned infrastructure, duplicated environments, or expensive compute choices that are not tied to customer value. When this happens, gross margin starts to slide even if top-line growth looks strong.
Sales efficiency gaps
If customer acquisition cost expands faster than lifetime value, operating margin suffers. Heavy discounting can mask this temporarily by preserving logo growth while reducing margin quality.
Services creep
Many SaaS companies add implementation and managed services to speed adoption. This can be strategic, but if services become a large revenue share, blended margins can dip because services are usually labor-heavy.
Support cost sprawl
Enterprise accounts with custom workflows can create support load that does not match price level. If support and success teams grow faster than recurring margin, net profitability compresses.
Javier's team faced this in a growing workflow SaaS company in Denver. They had strong headline gross margin, but support tickets doubled after a rapid enterprise push. By quarter-end they had added seven support hires and two solution engineers. Revenue was up, yet operating margin dropped because pricing had not been reset for service intensity. After they introduced tiered support and cleaned onboarding documentation, margin recovered over two quarters. The lesson was simple: product economics help, but operating design decides whether you keep the advantage.
For teams balancing profitability with investment decisions, the ROI calculator workflows help evaluate whether a margin-improvement project pays back fast enough.
A practical benchmark framework founders can use each quarter
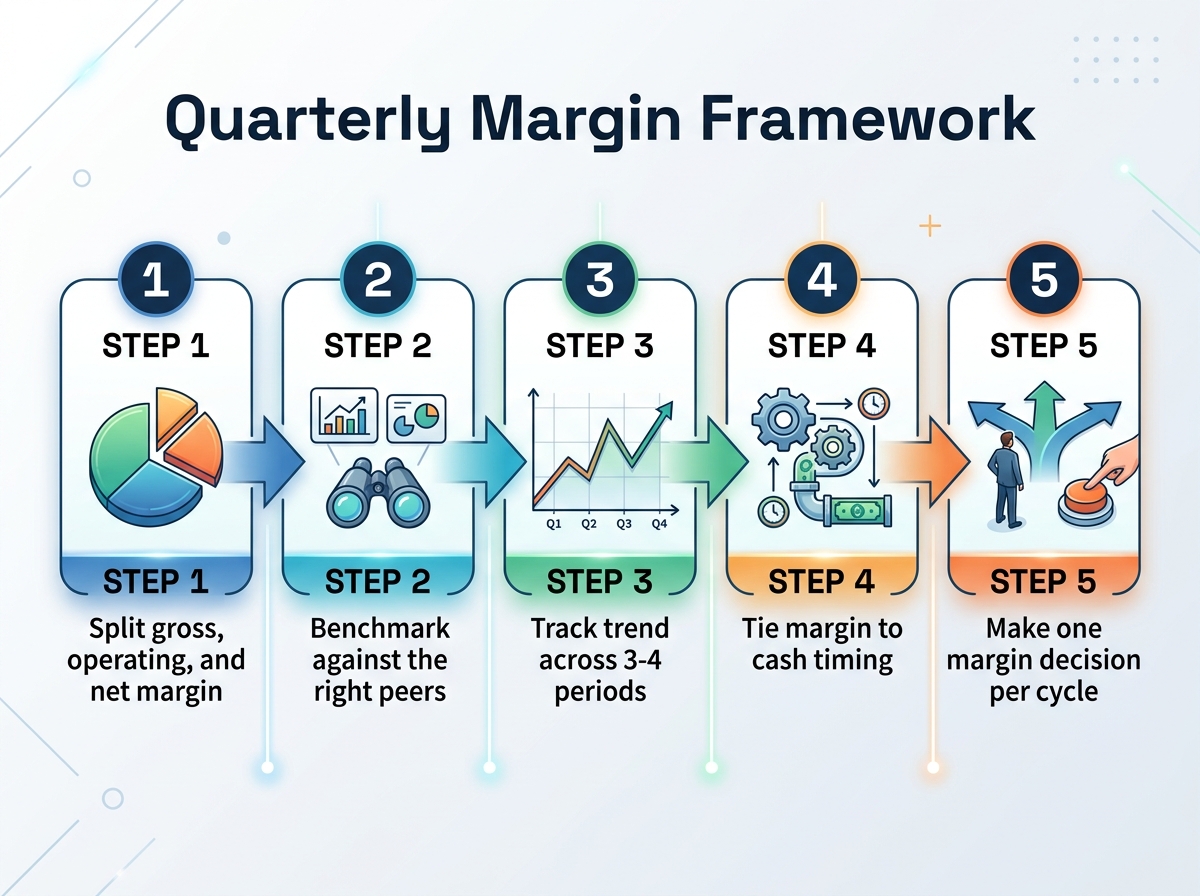
The most useful margin process is not complicated. It is repeatable.
Step 1: Split margin into three layers
Gross margin: direct delivery efficiency
Operating margin: model efficiency after sales/admin/product overhead
Net margin: after financing and tax effects
If gross margin weakens, do not start with branding debates. Start with direct cost and packaging decisions.
Step 2: Compare to appropriate peers, not generic averages
Use your vertical and model context:
SMB-focused SaaS and enterprise-focused SaaS can have different support and sales profiles.
Product-led and sales-led motions produce different operating margin trajectories.
Hybrid SaaS-plus-services businesses should benchmark blended and pure-software margins separately.
Step 3: Track trend, not one quarter in isolation
A single period can be noisy. Three to four periods reveal whether margin change is structural or temporary.
Step 4: Tie margin to cash timing
Even in SaaS, annual prepay cycles, commission structures, and infrastructure commits can create short-term pressure. Margin is stronger when paired with healthy cash conversion.
Step 5: Make one margin decision per cycle
Examples:
raise pricing for high-support segments,
reduce onboarding friction to cut implementation effort,
optimize cloud usage and rightsizing,
remove low-margin custom commitments from new contracts.
Trying to change everything at once makes it hard to identify which move improved margin.
What traditional industries can still teach SaaS operators
It is easy to present this as SaaS good, traditional bad. That is lazy analysis. Traditional operators often outperform SaaS teams in execution areas that also lift software margins:
strict unit-cost visibility,
disciplined procurement cadence,
tighter inventory-style planning for capacity,
stronger weekly operating reviews.
SaaS founders who combine software economics with operational rigor usually outperform peers who rely on model advantages alone.
Elena runs a payroll SaaS product for small hospitality groups. Her background was in restaurant operations, not software. She brought restaurant-style weekly dashboards into her product team: ticket volume by account segment, margin by package tier, and exception review for support-heavy customers. While competing products were talking about growth narratives, Elena's team improved gross margin and cut response times in the same quarter. The operating cadence came from a traditional sector mindset, and it made a digital business stronger.
If you want a broader view of how sector context changes interpretation, browse the industries overview and align your analysis to a realistic peer set.
Common mistakes when comparing SaaS to traditional margin data
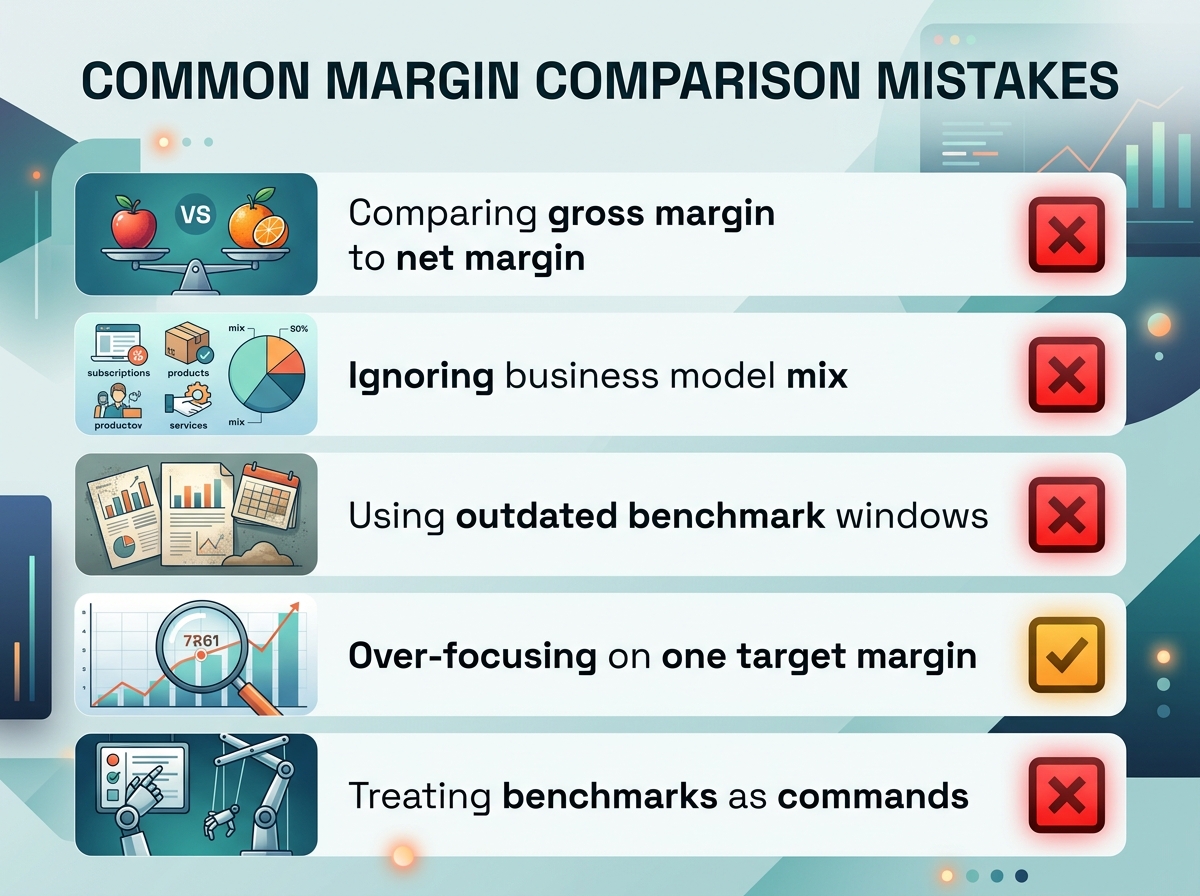
Mistake 1: comparing gross margin to net margin
This sounds obvious, but it happens often in executive updates. Always compare equivalent layers.
Mistake 2: ignoring business model mix
A SaaS company with large services revenue may not resemble pure-play SaaS benchmarks.
Mistake 3: using outdated benchmark windows
Cloud pricing, wage pressure, and channel behavior shift over time. Use recent data and update assumptions regularly.
Mistake 4: over-focusing on one "target margin"
A margin target without growth, retention, and cash context can push bad choices. For example, cutting support cost aggressively can improve short-term margin but hurt retention and net revenue quality later.
Mistake 5: treating benchmarks as commands
Benchmarks are reference points, not instructions. The right question is not "Are we at 80 percent?" The right question is "Are we improving margin quality while keeping customer outcomes strong?"
FAQ: SaaS profit margin versus traditional industries
Is SaaS always more profitable than traditional industries?
No. SaaS often has structurally higher gross margin potential, but poor acquisition efficiency, cloud waste, and support overhead can still produce weak net margins.
What is a good SaaS gross margin?
Many operators use above 75 percent as a healthy benchmark and 80 percent or higher as top-tier territory, with stage and model caveats.
Why are retail and transport margins usually thinner?
They often carry higher variable costs per unit sold, including inventory, logistics, returns, and commodity-sensitive inputs that scale more directly with volume.
Can a traditional business reach strong margins too?
Absolutely. Differentiated products, pricing discipline, and efficient operations can produce strong margins in many non-software sectors.
Should I optimize gross margin or net margin first?
Start with gross margin drivers. If direct economics are weak, operating and net fixes tend to be temporary.
Conclusion
The reason SaaS businesses often show higher profit margins than traditional industries is structural: software delivery can scale without direct cost rising at the same pace as revenue. Recurring contracts, multi-tenant architecture, and productized onboarding reinforce that edge. Benchmark data supports the pattern, but it also shows the caveat: structural advantage only helps if operating discipline keeps acquisition, cloud, and support costs under control.
If you are making pricing or growth decisions this quarter, do not stop at revenue trends. Compare gross, operating, and net margins, then pressure-test those numbers against your industry and delivery model. That process gives you better decisions than either optimism or fear.
Next step: run your current numbers through the profit margin calculators, compare against sector context, and decide one margin-improvement move you can ship in the next 30 days.

The video below gives a quick walkthrough of SaaS gross margin calculation basics:
Priority calculators
Use the calculator pages that support this topic
These direct utility pages add the industry-specific calculator and methodology context most likely to help while you read the article.
SaaS ROI
See our SaaS ROI Calculator for subscription growth decisions
Model CAC payback, retention, gross margin, and expansion assumptions before increasing growth spend.
Open calculatorSaaS margin
Use our SaaS Profit Margin Calculator to check unit economics
Pressure-test gross margin, support burden, and delivery costs before treating recurring revenue as healthy.
Open calculatorSaaS planning
Draft a SaaS business plan with subscription-specific assumptions
Turn revenue model, market, product, and cash assumptions into a structured planning draft.
Open calculatorStay in the loop
Get product updates and editorial highlights. Manage email preferences in your account settings.
Sign in for freeRelated calculators
Use these tools when you want to turn the article guidance into a calculation, estimate, or operating draft.
More articles

SaaS
SaaS SEO in 2026: How to Rank a SaaS Website in Google and AI Search
Learn SaaS SEO in 2026: rank a SaaS website in Google and AI search with technical fixes, intent-led content, and GEO tactics. Get the checklist.
SaaS
The Real Reason Most SaaS Startups Never Grow (And How to Fix It)
Most SaaS startups fail to grow when churn, weak expansion, and cash timing cancel acquisition. Learn the metrics and 90-day plan for durable growth.

SaaS
The Rise of Agentic SaaS: A Founder's Guide to Autonomous Operations
Move beyond chatbots. Learn how Agentic SaaS is changing unit economics, profit margins, and planning for founders. Discover the ROI of autonomous AI agents.

Strategy
How Hedera Solves Scalability for Business Applications (2026)
How Hedera Solves Scalability for Business Applications (2026) Meta Description: Hedera's hashgraph consensus delivers 10,000+ TPS with 2.9-second finality and fixed low fees. See how the architecture, governance, and real benchmarks solve scalability for enterprise payments, tokenization, supply ch

Strategy
Zero-Click SEO: How to Win Authority and Revenue Without Website Clicks
68% of searches end without a click. Learn the Zero-Click SEO strategies to win AI citations, Featured Snippets, and brand authority in the click-less era.

Strategy
Why Enterprises Are Choosing Hedera Over Traditional Blockchains
Discover why Google, IBM & Dell choose Hedera. Explore the benefits of fixed fees, aBFT security, and why Hedera is the audit trail for the AI economy.

Marketing
Google's AI Overviews Are Stealing Your Traffic (And Why That’s a Good Thing)
Google's AI Overviews are cutting CTR by 60%. Learn how to survive the zero-click era with GEO strategies, "Answer-First" formatting, and AI citation targeting.

Finance
Profit Margin Insights Every Entrepreneur Must Know to Build a Sustainable Business
What is a good profit margin for a small business? Learn industry-aware benchmarks and practical pricing and cost moves to build sustainable profit.
Strategy
How to Identify High-Margin Products & Eliminate Low Profit
Stop chasing revenue that doesn't pay. Learn how to identify high-margin products, calculate contribution margin, and prune unprofitable services in 2026.
Pricing
Calculate Your Business Profit Margin Instantly with Industry-Specific Insights
Calculate your business profit margin instantly. Compare your gross and net margins against industry benchmarks for SaaS, Retail, Consulting, and more.
Finance
Why Businesses Fail With High Revenue: Margins and Cash Matter More Than Sales
Why businesses fail despite high revenue: the hidden role of profit margins
SaaS
Profit Margin Benchmarks by Industry: SaaS, Retail, Healthcare & More
Compare industry profit margin benchmarks for SaaS, retail, and healthcare. Gross vs net, correct peer groups, then run free margin math on ToolsToFind.
Construction
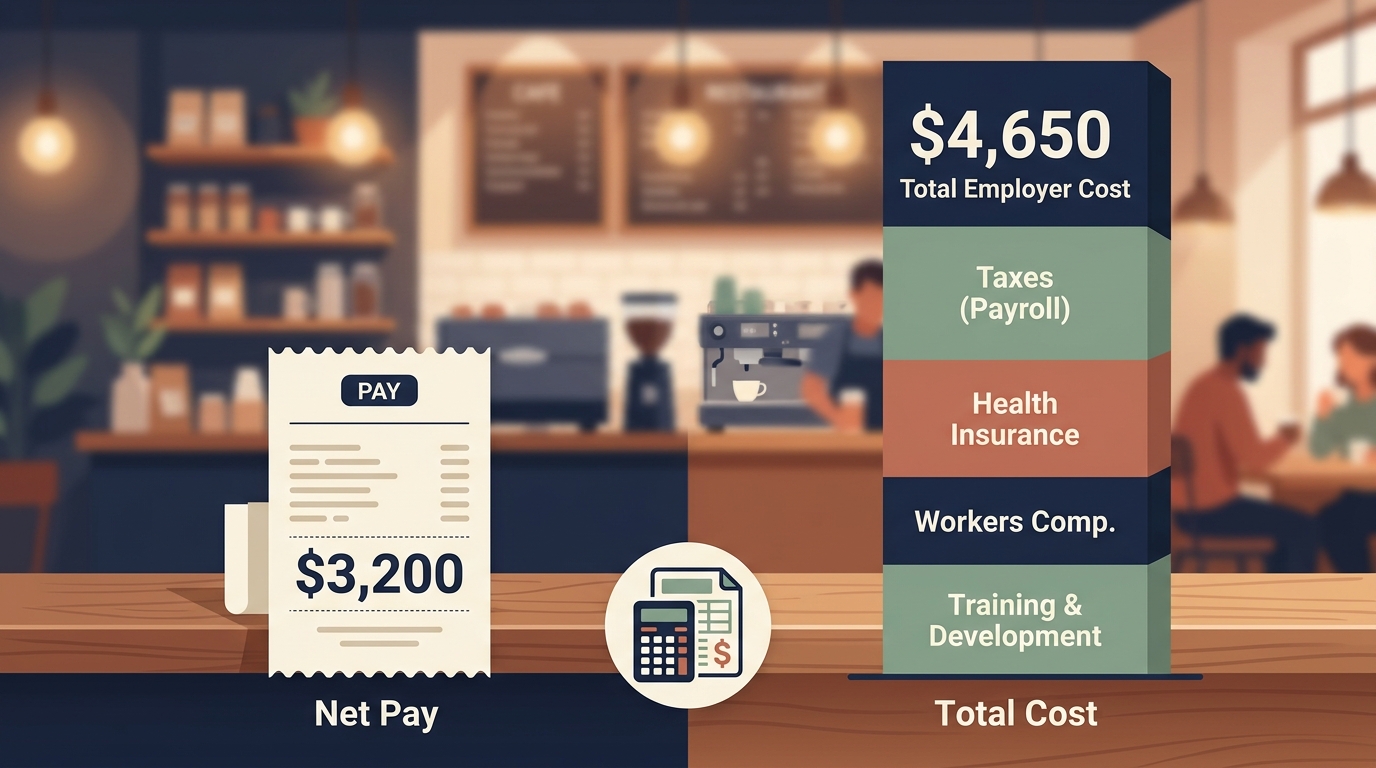
Payroll Calculator for Restaurants: Loaded Cost vs Salary for Your First Hire
Use a payroll calculator for restaurants to estimate loaded labor cost, not just salary, before your first hire in a 5-person team.

Operations
Break-Even Analysis for Service Businesses
Use break-even analysis to set minimum pricing, workload targets, and hiring timing before growth creates operating strain.

HR
First-Hire Payroll Mistakes to Avoid
Model the full cost of a first employee before you hire so payroll taxes, setup work, and role design do not surprise the business.

Finance
Invoice Follow-Up System for Faster Payments
A useful invoice follow-up process reduces days sales outstanding without turning collections into a messy manual scramble.

Hospitality
Restaurant Labor Cost Benchmarks
Restaurant labor targets only help when they are tied to service model, scheduling realities, and how the team actually staffs peak periods.

Manufacturing
Manufacturing Unit Economics Basics
Unit economics in manufacturing start with cost structure, throughput, and margin discipline, not just with revenue per order.

Operations
Working Capital Planning for Growth
Growth often tightens liquidity before it improves it, which is why working-capital planning matters most when the business is expanding.
Pricing
Gross Margin vs Markup for Pricing Decisions
Gross margin and markup are related but not interchangeable, and mixing them up is one of the easiest ways to underprice work.

Operations
Capital Budgeting for Small-Business Equipment Purchases
Equipment decisions need more than a lease quote and a productivity hunch. Capital budgeting helps test whether the purchase actually improves the business.

Operations
Capacity Planning for Professional Services Teams
Capacity planning in professional services is not only a staffing exercise. It shapes pricing, delivery quality, and which work the firm should accept.

Retail
Retail Seasonal Inventory Planning Without Overbuying
Seasonal inventory planning should balance sell-through, cash exposure, and markdown risk rather than pushing the business into one oversized bet.