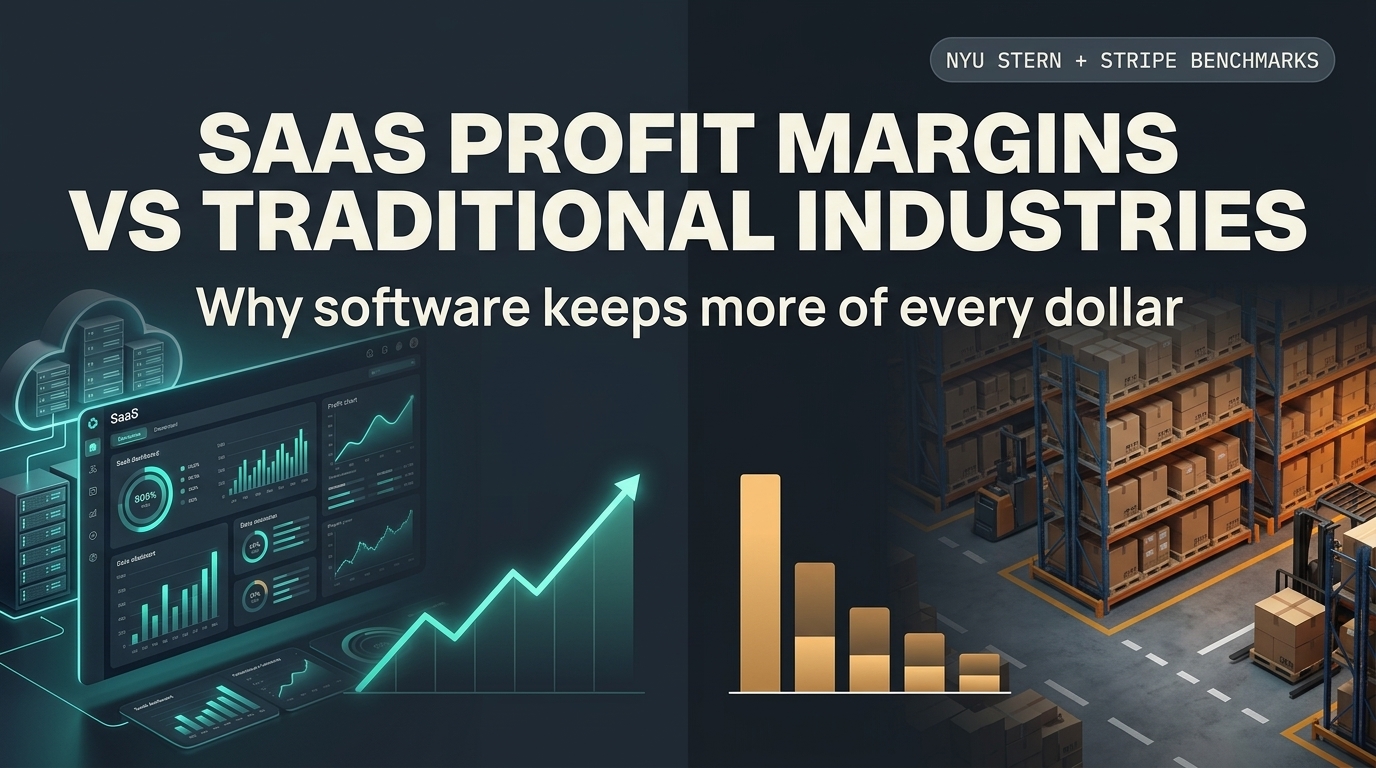
Profit Margin Benchmarks by Industry: SaaS, Retail, Healthcare & More
Industry profit margin benchmarks only help if you match the right margin type (gross, operating, or net), the right peer group, and the right industry segment. A strong net margin in one sector can be a red flag in another, and healthcare is not one number across hospitals, payers, and biotech.
That mismatch is why owners read a table online, feel bad about their business, and still miss what is actually broken in pricing or cost structure.
If you want realistic comparisons, this guide walks through how benchmarks work, what ranges people usually discuss for SaaS and retail, why healthcare needs segmentation, and how to turn a benchmark into a next step you can use in a pricing conversation.
Last March, Priya ran a home-goods shop online. She saw an article listing "retail" net margins near 3% and panicked, even though her boutique line was healthy for her category. The table blended mass merchants, grocers, and specialty retailers. Once she reframed around apparel specialty peers and her own fulfillment costs, she stopped chasing an average that was never meant to describe her shop.
If you have ever done the same math mistake with industry profit margin benchmarks, the sections below should save you a quarter of second-guessing.
Snapshot: which margin people usually mean
Sector | Margin people quote first | Why benchmarking trips people up |
|---|---|---|
SaaS | Gross margin | Services-heavy COGS can make software look "non-SaaS" if you do not read footnotes. |
Retail | Net margin (headlines) or gross (buyers) | "Retail" blends grocery, electronics, and specialty; averages bury your category. |
Healthcare | Operating margin (systems) | Hospitals are not the same economic animal as physician offices or payers. |
Key Takeaways
Industry profit margin benchmarks are only as good as the margin definition (gross vs operating vs net) and the peer group (segment, size, geography).
SaaS conversations usually emphasize gross margin (often 70%+ targets for scalable software at maturity, lower when services or heavy support inflate COGS).
Broad retail often shows thin net margins; gross margin swings wildly by category (grocery vs electronics vs apparel).
U. S. hospital operating margins move with payer mix, volumes, and expenses, so cite a source and a year instead of one eternal "healthcare margin."
The practical move is to pick peers, compare gross first, then net, then adjust pricing and cost levers with a calculator, not a headline.
Why industry profit margin benchmarks confuse even smart operators
Benchmarks travel faster than context. A chart titled average profit margin by industry can mix:
Public companies with solo LLCs
Subsidy-heavy lines with clean subscription revenue
Different accounting policies for what counts as COGS
You are not trying to win a trivia game. You are trying to answer three practical questions:
Are you roughly in range for how you make money (model + segment)?
Where is the real gap: price, direct cost, or overhead?
What do you change next week: packaging, supplier, schedule, discount policy, or headcount plan?
That is why solid margin benchmarks should arrive with footnotes. If your benchmark has no footnote, treat it like a rumor.
Want to anchor your numbers before you read another table? Plug your revenue and costs into the profit margin calculator hub so you know your gross and net story in the same format you will compare to peers.
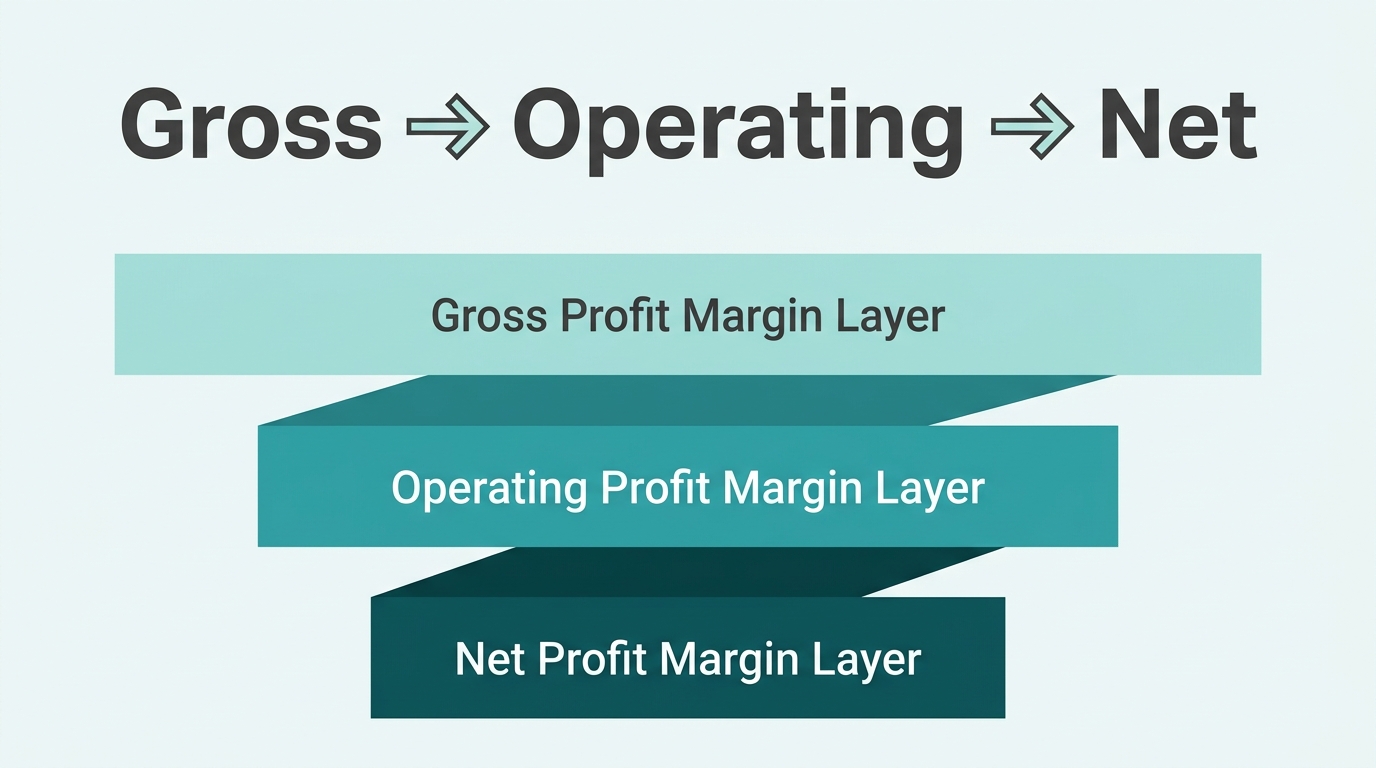
Quick definitions: gross, operating, and net margin
Gross margin
Gross margin answers: after direct costs to serve a customer, what is left?
It is the foundation in retail and often the headline in software because it shows whether the core offer is priced sensibly against direct delivery cost.
Operating margin
Operating margin steps down through operating expenses like sales, marketing, admin, and R&D (where those sit above gross profit). It is useful for asking whether the business system around the product is efficient.
Net margin
Net margin is what is left after taxes, interest, and other below-the-line items, depending on the statement. It is closest to "what actually hits your bank account over time," but it is also sensitive to debt, one-time events, and tax timing.
If someone quotes industry profit margin benchmarks without naming which margin, stop and ask. Half of the confusion in forums comes from comparing someone's gross figure to your net.
How to read industry profit margin benchmarks without lying with statistics
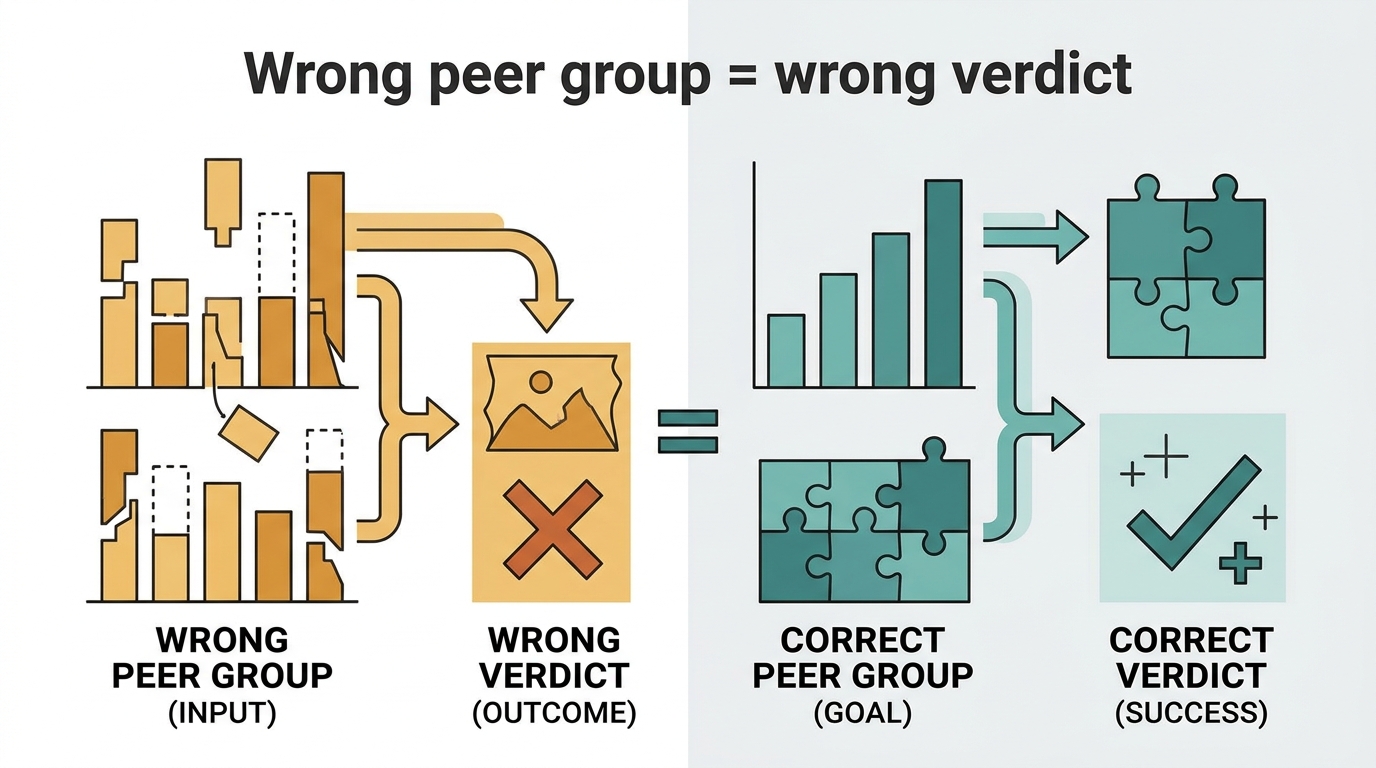
Match the peer group, not the national label
NAICS codes and "sector averages" are starting points, not destiny. A seven-location specialty retailer is not the same peer set as a national grocery chain, even if both say "retail."
When you evaluate profit margin benchmarks by industry, tighten the peer group:
Company size (revenue band and headcount)
Go-to-market (SMB vs enterprise, online vs brick-and-mortar)
Geography (state taxes, shipping lanes, labor markets)
Watch COGS definition, especially in SaaS
SaaS gross margin can look "low" if a firm books heavy onboarding, managed services, or customer success labor into COGS. That does not automatically mean the software is bad. It means the benchmark is not comparable until you know what the company classifies where.
That is a common founder trap:
In 2024, Diego pitched investors for his B2B SaaS tool. His gross margin looked closer to 60% because implementation hours sat in COGS. Competitors with a lighter services model showed 75% or more.
The fix was not shame. The fix was clearer packaging: standardized onboarding tiers, tighter scopes, and a truthful segment label so benchmarks for pure SaaS were not the reference line for a hybrid model.
If you are in SaaS, pairing margin work with a finance-forward tool stack helps. Browse the SaaS industry hub for calculators that match subscription economics, and use the SaaS ROI calculator when the conversation is payback, not just margin percent.
Retail: learn markup versus margin before you compare
Retailers discount constantly. If you confuse markup with margin, a "20% promotion" can erase profit you thought was safe.
If discounts are part of your world, read gross margin vs markup for pricing decisions next. It is the fastest way to align sales and finance on what a price change really does.
SaaS profit margin benchmarks: gross margin is the usual headline
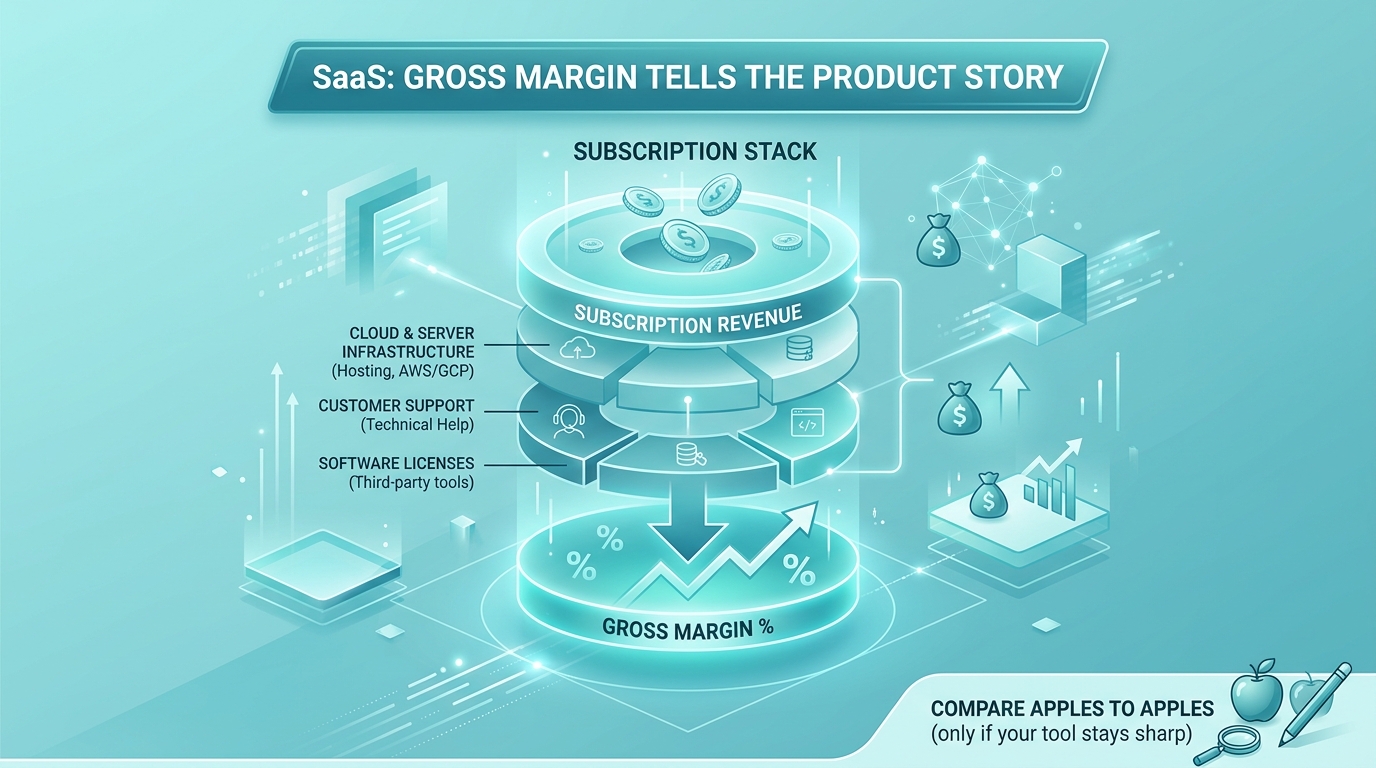
Investors and operators often talk about SaaS gross margin because it signals how much room exists to fund growth after direct delivery. Mature software businesses frequently land in 70% to 80%+ gross margin when the model is primarily subscription software with COGS like hosting, third-party fees, and direct support costs classified consistently.
Early-stage companies and hybrid service models can sit lower. That is not automatically "bad." It is a different product shape.
Why net margin is a different conversation
Net margin for SaaS includes sales and marketing spend, R&D, and G&A. A firm can show strong gross margin and still post negative net margin while reinvesting for growth. Benchmark the story you are actually telling: unit economics and payback, not a single percentage lifted from a blog chart.
For a sector checklist and vertical tools, the SaaS industry hub is the cleanest next click after you understand your gross vs net split.
Retail and e-commerce profit margin benchmarks: thin net, noisy gross

Retail is where benchmarks by sector mislead the fastest, because "retail" hides giant differences. Mass-market grocery runs different economics than luxury goods or electronics.
You will often see low single-digit net margins for broad retail averages in public data sources, while gross margin swings by category. Investopedia's discussion of typical retailer margins is a useful starting point for how broad retail behaves (Investopedia).
E-commerce adds fulfillment and returns
Shipping, packaging, and returns can move gross margin quickly. Two shops with the same sticker price can have different economics if one sells heavy goods cross-country and the other sells lightweight accessories with low return rates.
Selling online and want a category-aligned next step? Model category-specific flows with the e-commerce profit margin calculator path on ToolsToFind.
Healthcare profit margin benchmarks: segment or stop

Treat "healthcare" like five or six industries, not one.
Hospitals and health systems often focus on operating margin, and that number swings with payer mix, labor costs, and non-labor expenses. Summaries from organizations like KFF explain why hospital finances are often discussed separately from other parts of healthcare (KFF).
Physician practices, pharma, payers, and device makers use different revenue models and different margin language.
If you quote industry profit margin benchmarks for healthcare, quote the segment, the metric, and the source year. Otherwise you are arguing about a moving target.
Manufacturing, restaurants, and professional services (short checkpoints)
You do not need a full chapter for every NAICS code to publish a useful overview. You need the right mental model.
Manufacturing often forces discipline on contribution margin by product line because overhead allocation can hide weak SKUs.
Restaurants blend food cost, labor, and fixed occupancy. If labor is your stress point, pair margin work with real hospitality labor context like restaurant labor cost benchmarks.
Professional services frequently breaks on utilization and hourly realization, not on whether a random "net margin" sounds nice.
Cross-check sector tables against primary datasets when you publish firm numbers. Aswath Damodaran publishes widely used margin datasets by industry that many finance teams treat as a shared baseline (NYU Stern data page). Always confirm the latest refresh and what the dataset includes.
Nina runs a 12-person professional services firm. Her net margin looked "low" against generic industry profit margin benchmarks she found for "business services." Her issue was not moral failure. Her issue was mix: two whale clients paid premium rates, while a long tail of small jobs burned delivery hours. Benchmarks did not show that. A contribution report did.
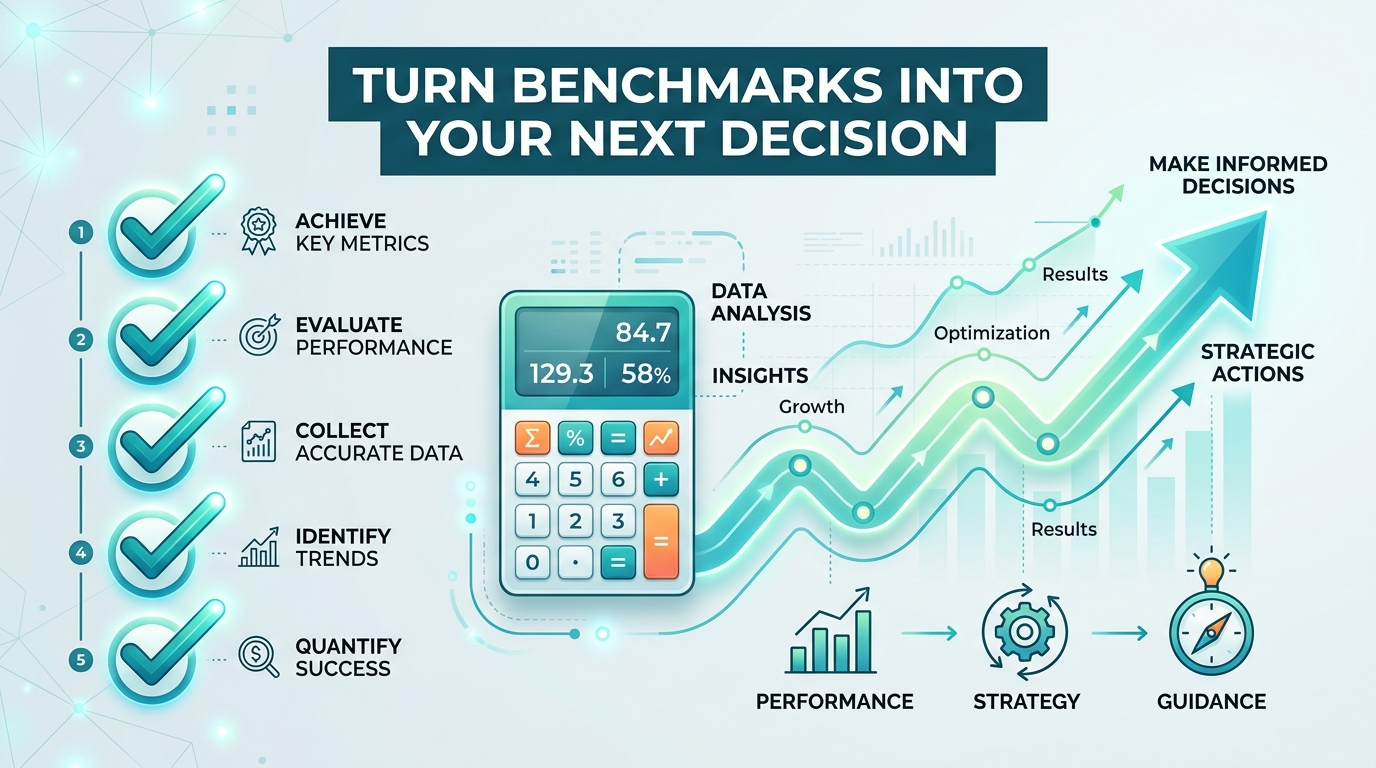
Turn industry profit margin benchmarks into a decision
Benchmarks are context, not destiny. Use them like a blood pressure reading: one number matters less than the trend and the treatment plan.
A simple checklist you can run in an hour
Pick one peer group you truly resemble (size, model, geography).
Split gross vs operating vs net on your own statements.
Compare gross first. If gross is off, fix pricing, COGS, or product scope before you torch marketing.
Compare net second. If gross is fine but net is ugly, scrutinize overhead, debt, and growth spend.
Save your scenario so you are not redoing the same spreadsheet every quarter.
Pick your lane on the industries overview when you want industry-shaped tools rather than generic defaults. For a full list of calculators, open the ToolsToFind tools directory.
Ready to stop guessing? Start from the profit margin calculator hub, save your baseline, then iterate on price and cost drivers with numbers you can explain to a partner, lender, or investor.
If you hit export limits or want client-ready PDFs, see ToolsToFind pricing for what Free versus Pro includes.
Frequently asked questions (natural language)
What are industry profit margin benchmarks used for?
They show typical margin ranges by sector so you can sense-check your performance against companies that actually resemble yours, after you align gross, operating, or net definitions.
Why is my margin so different from the industry average?
Often because the "average" is not your segment, because COGS classification differs, because you are smaller or younger, or because one-time items moved net income.
Are SaaS margins supposed to be higher than retail margins?
People usually compare SaaS gross margin (high) to retail net margin (often low), which is a category error. Compare the same margin type.
What is a good profit margin for a small business?
A good margin is one that funds taxes, reinvestment, debt service, and owner goals in your model. Use peers first, then absolute targets.
Should beginners trust online tables for hospital margins?
Treat them as a reason to read primary reporting for the same year and segment, not as eternal truth.
Recommended video walkthrough
Use the video as a quick refresher on gross versus operating profit, then line your own numbers up beside peer industry profit margin benchmarks.
Conclusion
Industry profit margin benchmarks work best when they are narrow, labeled, and paired with your own statement math. SaaS tends to spotlight gross margin, retail punishes weak category or channel assumptions, and healthcare punishes lazy aggregation.
You do not need a perfect benchmark. You need a consistent definition, an honest peer set, and a calculator habit that turns percentages into decisions.
If you want one workspace for margin scenarios and saved outputs, start at the profit margin calculator hub. Keep refining with the SaaS industry hub, the e-commerce profit margin calculator, and when discounts enter the story, the gross margin vs markup explainer.
Priority calculators
Use the calculator pages that support this topic
These direct utility pages add the industry-specific calculator and methodology context most likely to help while you read the article.
SaaS ROI
See our SaaS ROI Calculator for subscription growth decisions
Model CAC payback, retention, gross margin, and expansion assumptions before increasing growth spend.
Open calculatorSaaS margin
Use our SaaS Profit Margin Calculator to check unit economics
Pressure-test gross margin, support burden, and delivery costs before treating recurring revenue as healthy.
Open calculatorSaaS planning
Draft a SaaS business plan with subscription-specific assumptions
Turn revenue model, market, product, and cash assumptions into a structured planning draft.
Open calculatorStay in the loop
Get product updates and editorial highlights. Manage email preferences in your account settings.
Sign in for freeRelated calculators
Use these tools when you want to turn the article guidance into a calculation, estimate, or operating draft.
Ecommerce store profit margin calculator
Include landed cost, shipping, returns, platform fees, markdowns, payment fees, ads, and overhead.
Dental ROI calculator
Connect investment cost to patient flow, collections, chair time, procedure mix, and payback timing.
More articles

SaaS
SaaS SEO in 2026: How to Rank a SaaS Website in Google and AI Search
Learn SaaS SEO in 2026: rank a SaaS website in Google and AI search with technical fixes, intent-led content, and GEO tactics. Get the checklist.

SaaS
The Real Reason Most SaaS Startups Never Grow (And How to Fix It)
Most SaaS startups fail to grow when churn, weak expansion, and cash timing cancel acquisition. Learn the metrics and 90-day plan for durable growth.

SaaS
The Rise of Agentic SaaS: A Founder's Guide to Autonomous Operations
Move beyond chatbots. Learn how Agentic SaaS is changing unit economics, profit margins, and planning for founders. Discover the ROI of autonomous AI agents.

Strategy
How Hedera Solves Scalability for Business Applications (2026)
How Hedera Solves Scalability for Business Applications (2026) Meta Description: Hedera's hashgraph consensus delivers 10,000+ TPS with 2.9-second finality and fixed low fees. See how the architecture, governance, and real benchmarks solve scalability for enterprise payments, tokenization, supply ch

Strategy
Zero-Click SEO: How to Win Authority and Revenue Without Website Clicks
68% of searches end without a click. Learn the Zero-Click SEO strategies to win AI citations, Featured Snippets, and brand authority in the click-less era.

Strategy
Why Enterprises Are Choosing Hedera Over Traditional Blockchains
Discover why Google, IBM & Dell choose Hedera. Explore the benefits of fixed fees, aBFT security, and why Hedera is the audit trail for the AI economy.

Marketing
Google's AI Overviews Are Stealing Your Traffic (And Why That’s a Good Thing)
Google's AI Overviews are cutting CTR by 60%. Learn how to survive the zero-click era with GEO strategies, "Answer-First" formatting, and AI citation targeting.

Finance
Profit Margin Insights Every Entrepreneur Must Know to Build a Sustainable Business
What is a good profit margin for a small business? Learn industry-aware benchmarks and practical pricing and cost moves to build sustainable profit.
Strategy
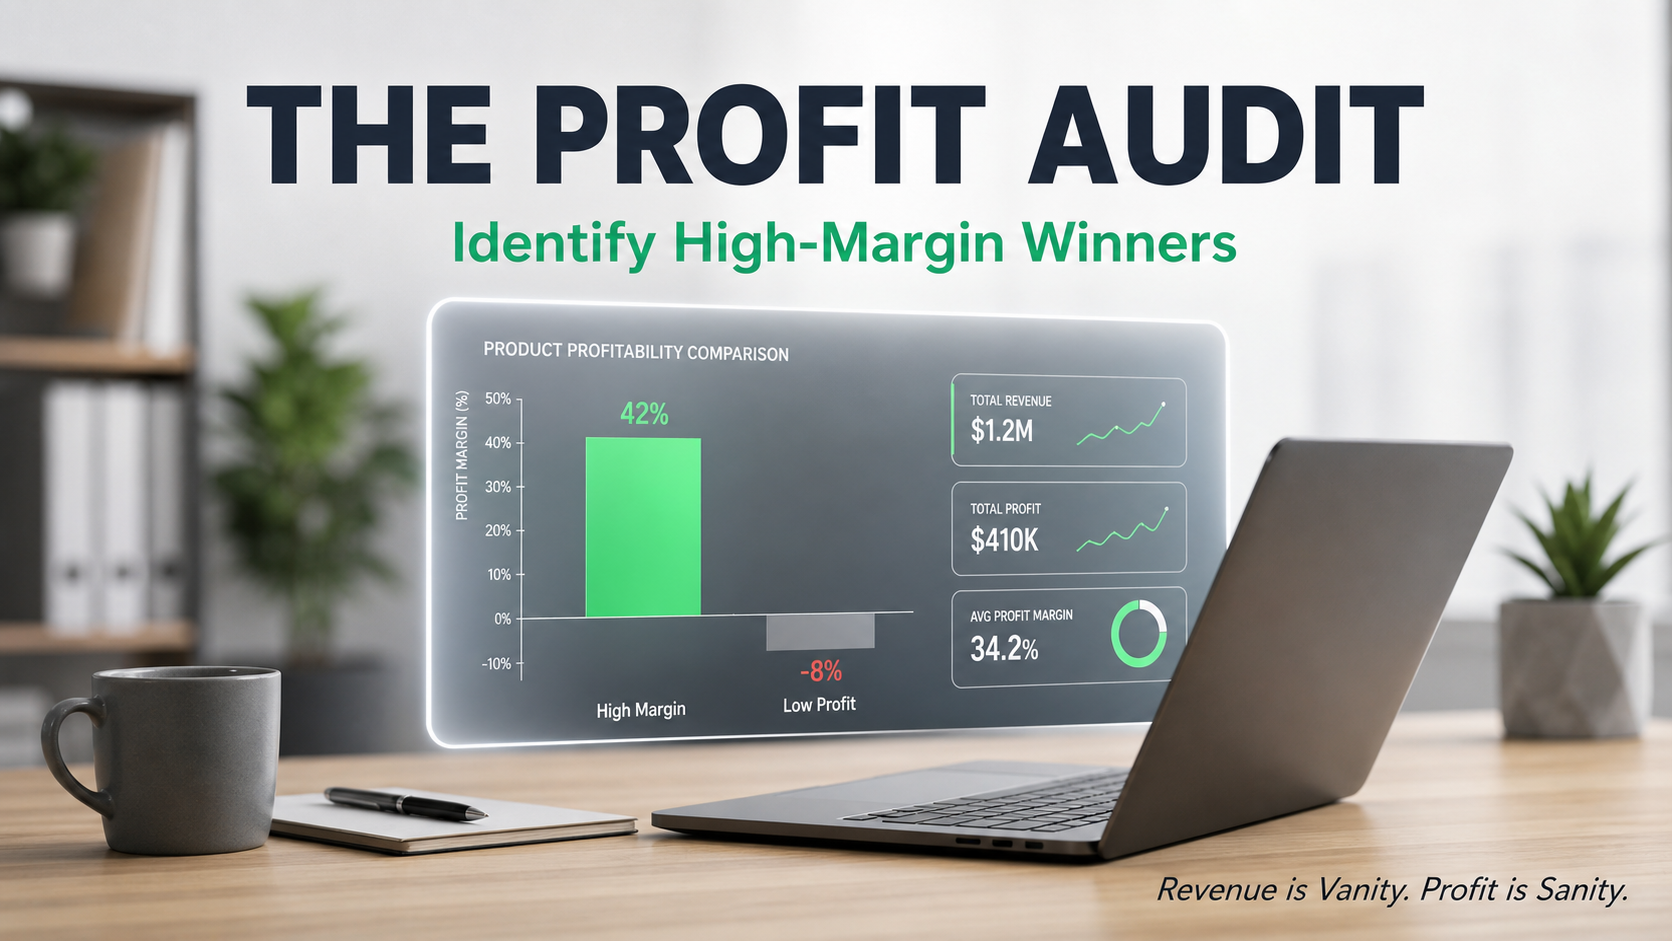
How to Identify High-Margin Products & Eliminate Low Profit
Stop chasing revenue that doesn't pay. Learn how to identify high-margin products, calculate contribution margin, and prune unprofitable services in 2026.
Pricing
Calculate Your Business Profit Margin Instantly with Industry-Specific Insights
Calculate your business profit margin instantly. Compare your gross and net margins against industry benchmarks for SaaS, Retail, Consulting, and more.
SaaS
Why SaaS Businesses Have Higher Profit Margins Than Traditional Industries
Learn why SaaS businesses often post higher margins than retail, transport, and other sectors, and how to benchmark your margin model with real data.
Finance
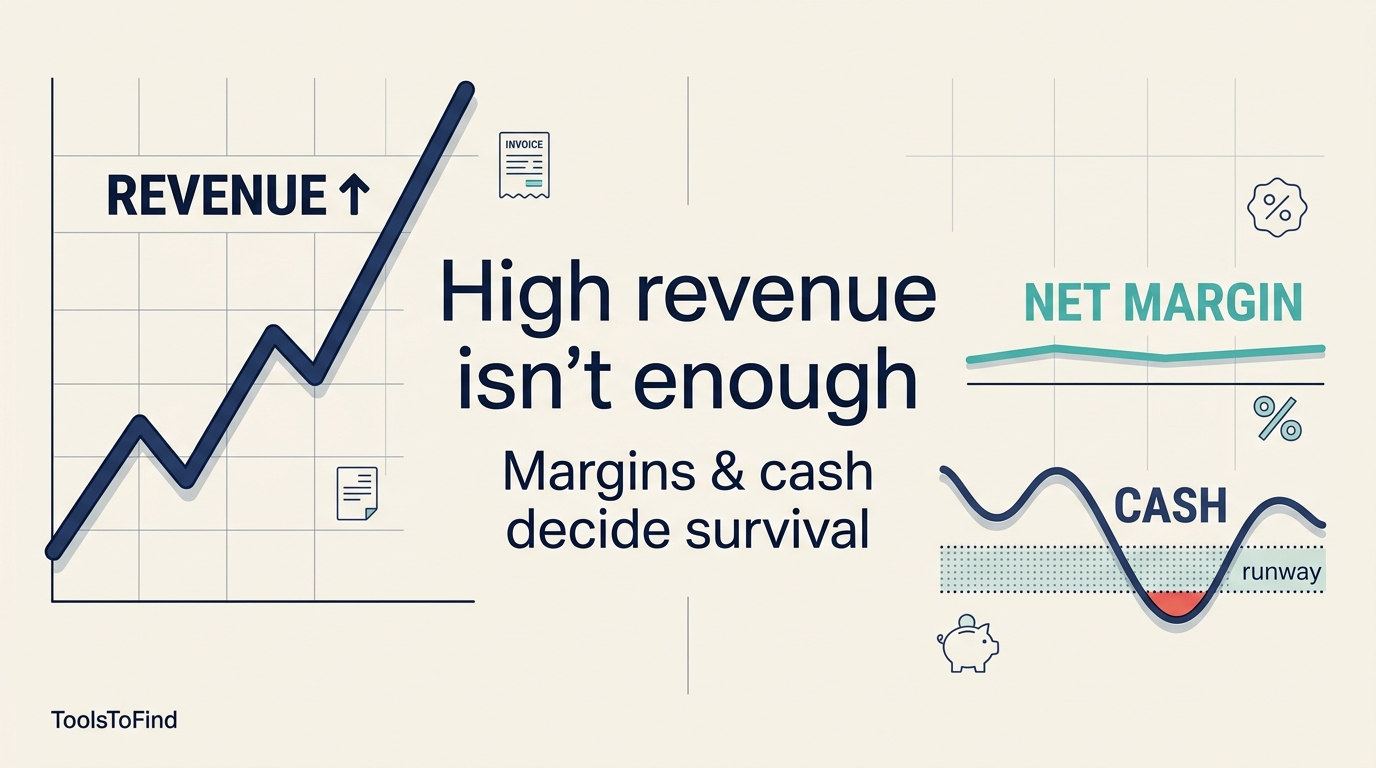
Why Businesses Fail With High Revenue: Margins and Cash Matter More Than Sales
Why businesses fail despite high revenue: the hidden role of profit margins
Construction
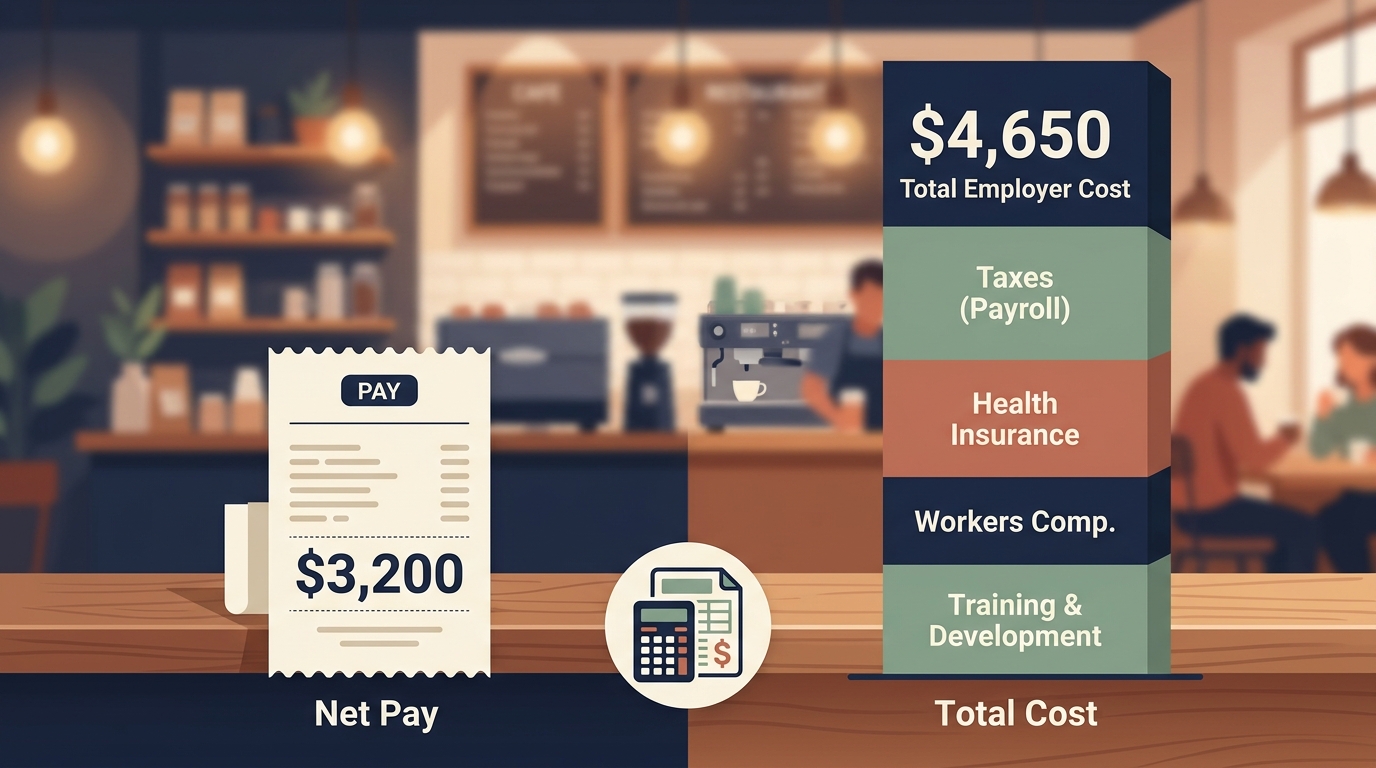
Payroll Calculator for Restaurants: Loaded Cost vs Salary for Your First Hire
Use a payroll calculator for restaurants to estimate loaded labor cost, not just salary, before your first hire in a 5-person team.

Operations
Break-Even Analysis for Service Businesses
Use break-even analysis to set minimum pricing, workload targets, and hiring timing before growth creates operating strain.

HR
First-Hire Payroll Mistakes to Avoid
Model the full cost of a first employee before you hire so payroll taxes, setup work, and role design do not surprise the business.

Finance
Invoice Follow-Up System for Faster Payments
A useful invoice follow-up process reduces days sales outstanding without turning collections into a messy manual scramble.

Hospitality
Restaurant Labor Cost Benchmarks
Restaurant labor targets only help when they are tied to service model, scheduling realities, and how the team actually staffs peak periods.

Manufacturing
Manufacturing Unit Economics Basics
Unit economics in manufacturing start with cost structure, throughput, and margin discipline, not just with revenue per order.

Operations
Working Capital Planning for Growth
Growth often tightens liquidity before it improves it, which is why working-capital planning matters most when the business is expanding.
Pricing
Gross Margin vs Markup for Pricing Decisions
Gross margin and markup are related but not interchangeable, and mixing them up is one of the easiest ways to underprice work.

Operations
Capital Budgeting for Small-Business Equipment Purchases
Equipment decisions need more than a lease quote and a productivity hunch. Capital budgeting helps test whether the purchase actually improves the business.

Operations
Capacity Planning for Professional Services Teams
Capacity planning in professional services is not only a staffing exercise. It shapes pricing, delivery quality, and which work the firm should accept.

Retail
Retail Seasonal Inventory Planning Without Overbuying
Seasonal inventory planning should balance sell-through, cash exposure, and markdown risk rather than pushing the business into one oversized bet.