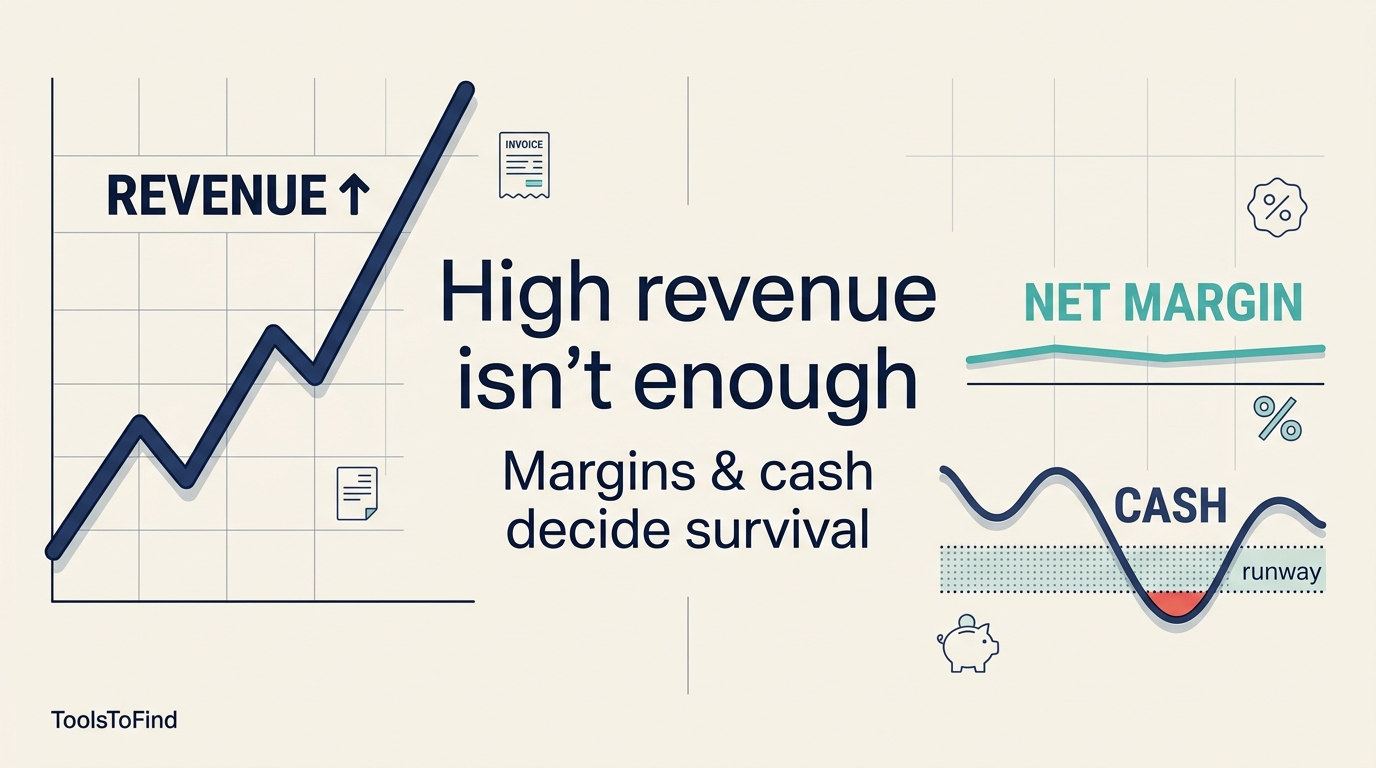
Why Businesses Fail With High Revenue: Margins and Cash Matter More Than Sales
Businesses often fail with high revenue because top-line sales do not guarantee healthy profit margins or enough cash on hand. When gross margin slips, operating costs absorb growth, or cash is tied up in inventory and receivables, a company can look “big” on paper while quietly running out of runway.
Nina runs a four-person marketing agency near Austin. In Q3 2025 her firm posted $420,000 in revenue, a personal best. She still nearly missed payroll in October. Client work had expanded, but discounts, scope creep, and contractor rush fees shaved contribution margin on half her accounts. Meanwhile, two enterprise clients paid on net-60 terms while payroll hit every two weeks. Nina’s story is common: why businesses fail with high revenue usually comes down to margin structure and timing, not a lack of customers.
You already sense that revenue can mislead. This article maps revenue to gross, operating, and net margins, then to cash flow, so you can spot weakness before it becomes a crisis. You will get a short checklist of warning signs and practical next steps, including how to stress-test numbers with industry context.
Preview: We start with what each profit layer measures, then cover why profitable businesses still go broke, how benchmarks change by industry, early signals to watch, and what to do next.
Key Takeaways
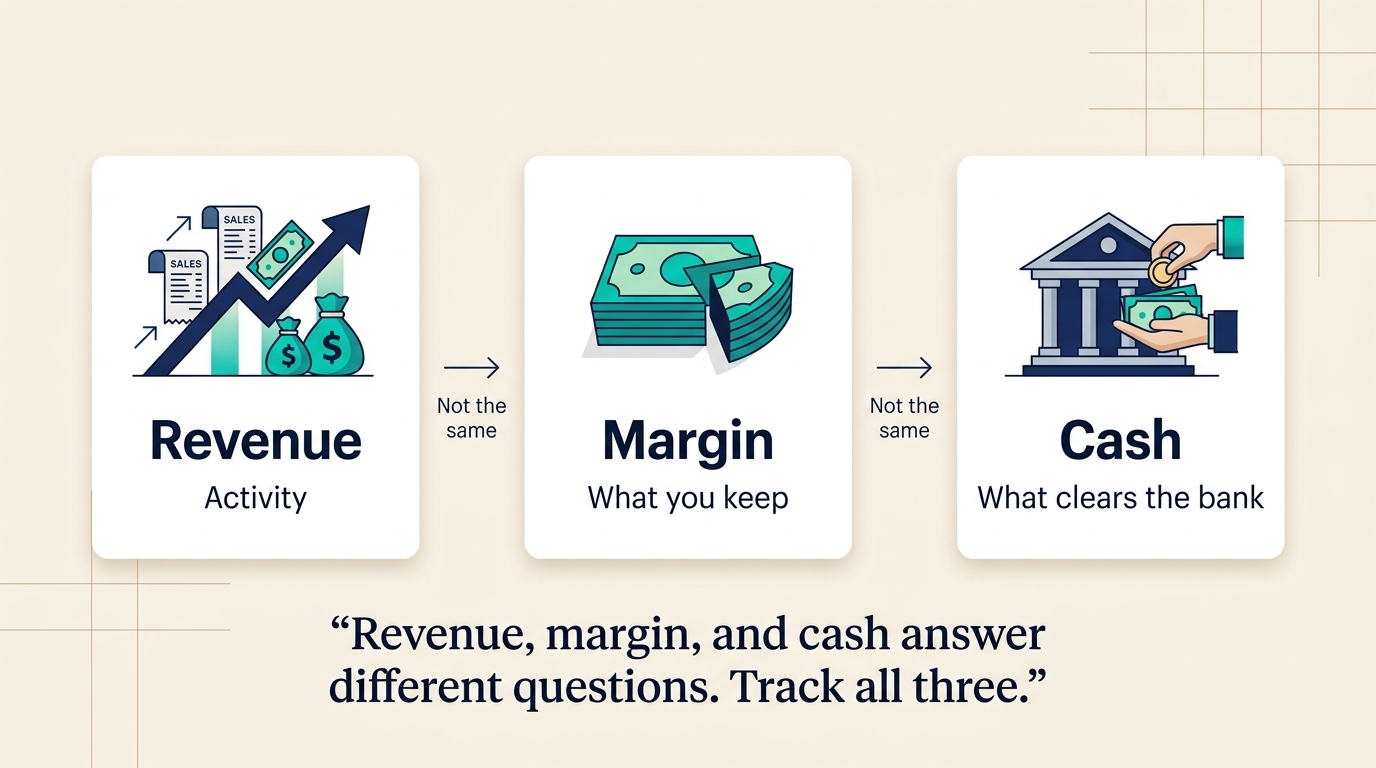
Revenue is activity; margin is what you keep after direct costs; cash is what you can spend when bills are due. The three diverge often, especially during growth.
Falling gross margin percentage (not just rising COGS dollars) is one of the clearest signs that growth is eroding unit economics, long before the brand feels “broken.”
Operating margin shows whether the core business model works after the week-to-week cost of running the shop, including labor and marketing that gross margin hides.
Working capital (inventory, receivables, payables) explains many “profitable but broke” months: accrual profit can look fine while the checking account drains.
Industry benchmarks turn percentages into decisions; a “fine” net margin in one sector may be dangerously thin in another.
If you want to run your own numbers with benchmark context, use the profit margin calculators on ToolsToFind, pick your industry, and compare gross and net results to typical ranges before you change pricing or hire.
Why businesses fail with high revenue: what top-line sales hide
Revenue is the value of what you sold in a period. It does not subtract product cost, labor to deliver, rent, software, interest, or taxes. That is why two companies with identical revenue can have opposite futures: one keeps forty cents of every dollar after direct costs; the other keeps fifteen.
Revenue vs gross profit vs operating profit vs net profit
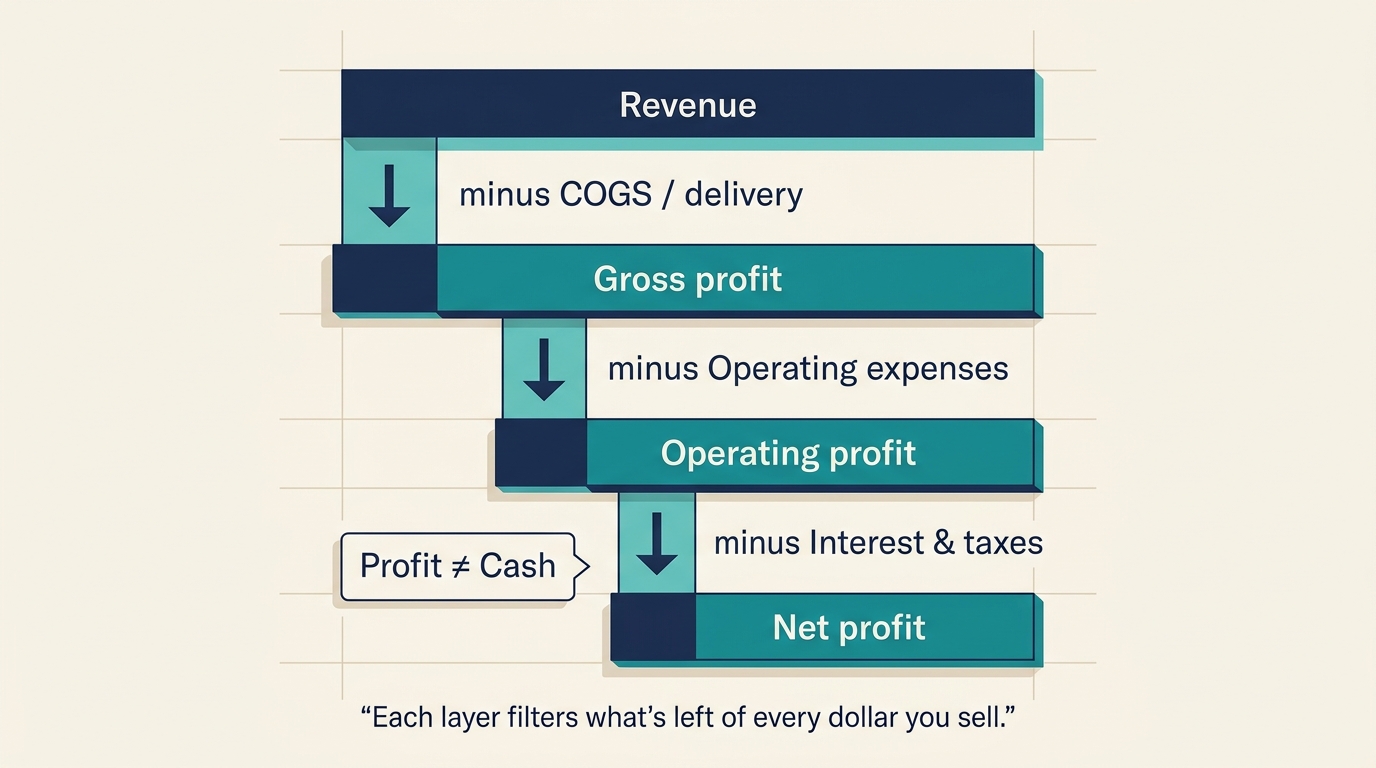
Think of profit as a set of filters stacked under revenue:
Layer | Plain meaning | What it answers |
|---|---|---|
Revenue | Sales to customers | Are people buying? |
Gross profit | Revenue minus direct costs (COGS / delivery) | After making or delivering, what is left? |
Operating profit | Gross profit minus operating expenses (sales, admin, payroll, marketing) | Does the core business model work week to week? |
Net profit | Operating profit minus interest, taxes, and other non-operating items | What is left for owners and reinvestment after everything else? |
Cash flow | Cash in and out in real time | Can we pay vendors and payroll this month? |
Gross margin is gross profit divided by revenue. Operating margin is operating profit divided by revenue. Net margin is net profit divided by revenue. Percentages matter because they show efficiency, not scale: $5M revenue at 18% gross margin can be weaker than $2M at 55% depending on operating fixed costs.
For pricing mechanics tied to markup decisions, see gross margin vs markup for pricing.
Why businesses fail with high revenue: gross, operating, and net margins
When people ask why businesses fail with high revenue, they are usually describing a margin story disguised as a volume story. Sales create motion; margins decide whether motion turns into stability.
Gross margin: pricing power and cost discipline
Gross margin exposes whether pricing and direct costs are under control. If revenue rises only because you discounted heavily or absorbed supplier inflation without passing it through, gross margin % falls. That is a structural hit, not a bad month.
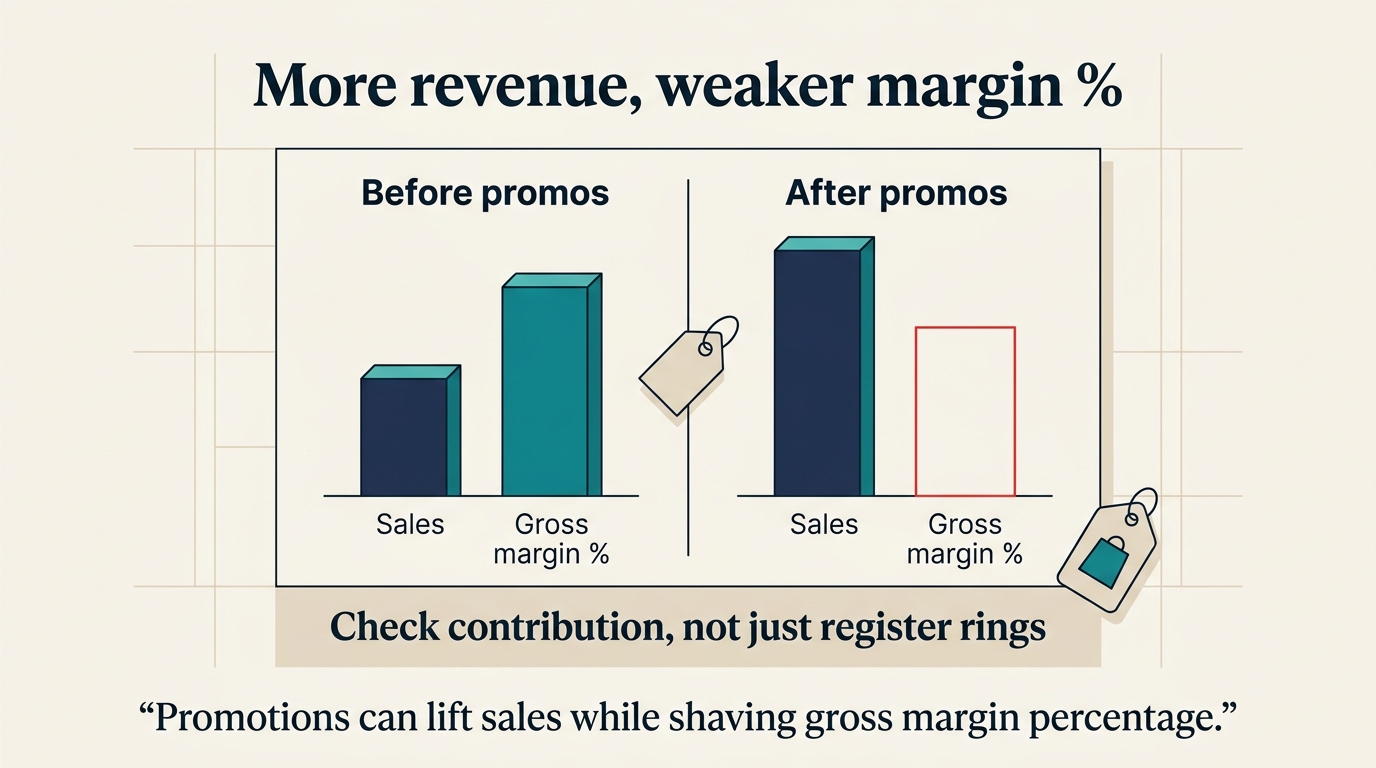
Retail owner Marcus in Columbus grew revenue 22% in 2025 by expanding SKUs and running aggressive promos. By December, gross margin % had slid four points versus the prior year. More dollars rang through the register, but each dollar brought less contribution to rent and payroll. That is how high revenue coexists with low safety.
Ready to see your gross and net picture in one pass? Open the profit margin calculator hub, select your industry, and plug in revenue, COGS, and expenses so you are not guessing whether the promotion helped or hurt.
Operating margin: the layer owners live in
Operating margin reflects sales, marketing, admin, and people costs that do not sit in COGS. Agencies, SaaS companies, and restaurants hit trouble here when revenue scales but headcount and tools scale faster.
A healthy operating margin means the business earns enough from operations to survive routine shocks. A thin operating margin with high fixed costs means volume must stay high forever, or the business tips quickly.
Net margin: what is left after the balance sheet and capital structure bite
Net margin includes interest, taxes, and other items below operating income. You can have decent operating margins and weak net margins if debt service is heavy or one-time charges hit. For owners, net margin is closer to “what we can actually reinvest or distribute,” but it still is not cash until timing lines up.
If you are weighing equipment, a new location, or a hire against thin margins, model payback with the ROI calculators before you commit.
Why profitable businesses still run out of cash
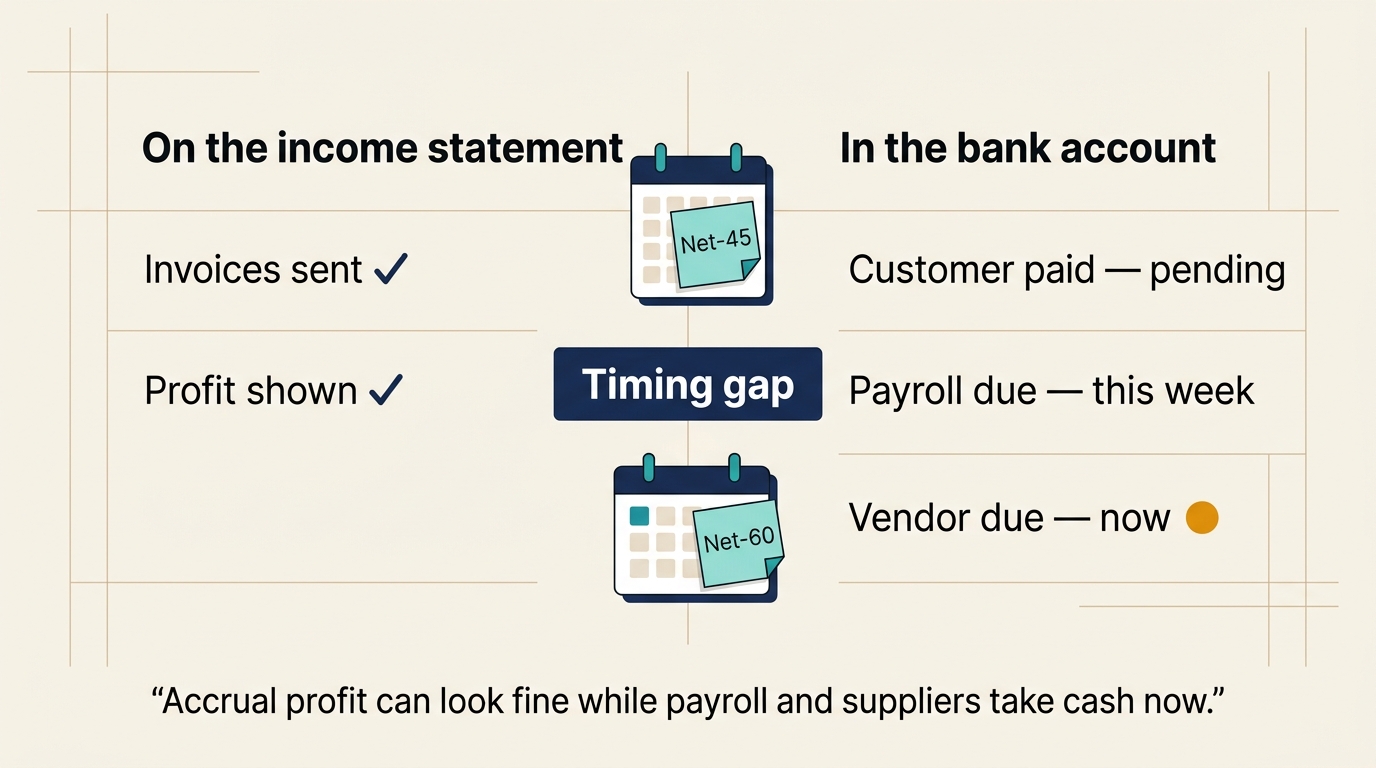
Profit is an accounting story for a period. Cash is what clears the bank. That gap explains many failures that confuse founders and even some lenders.
Accrual accounting can record revenue when you invoice, not when the customer pays. If accounts receivable stretch from 35 to 68 days, you can show profit while payroll and suppliers demand cash now. Inventory-heavy businesses tie up cash in stock ahead of sales. Fast growth often consumes working capital because you fund more product, more people, and more receivables before new cash returns.
Debt service, equipment purchases, and owner draws also drain cash without showing up in “operating profit” the way operators expect. Seasonal businesses can show a fine year on paper and still hit a February cliff.
Leo sells B2B workflow software from Seattle. ARR crossed $1.2M in January 2026 and the board slide looked strong. Most customers paid annually upfront, but a fortune-500 pilot billed quarterly on net-45. Leo also prepaid eighteen months of cloud commit to lock a discount. On paper the quarter was profitable; in practice the bank balance dipped under $40k twice while payroll and the prepayment hit in the same month. Cash flow vs profit was not a textbook idea anymore. It was payroll risk.
For a deeper editorial walkthrough of growth and liquidity, read working capital planning for growth. The Federal Reserve’s Fed Small Business surveys and discussion materials are also useful for grounding financing stress in real SMB data rather than anecdotes.
The video below walks through how cash timing differs from profit on the income statement (helpful if you learn visually):
Industry context: why benchmarks matter
Margins are not moral; they are contextual. SaaS often emphasizes high gross margins but significant sales and R&D spend. Retail may show lower gross margins but faster inventory turns. Hospitality fights labor and food cost volatility. Professional services live in utilization and hourly leakage.
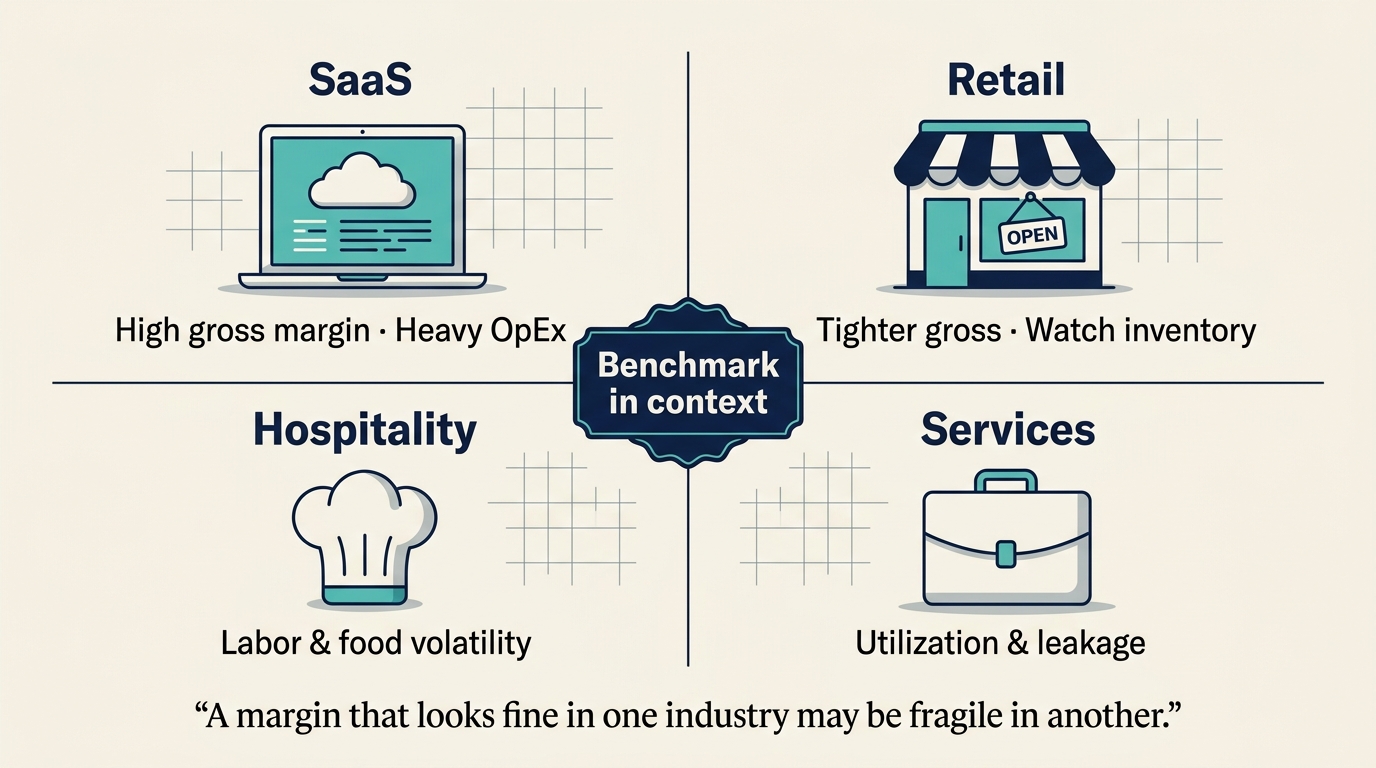
A net margin that looks “okay” in one sector may be fragile in another because risk, capital needs, and competition differ. That is why industry profit margin benchmarks belong in the same conversation as your own percentages. ToolsToFind builds industry selection into margin workflows so you are not comparing your shop to a national average that hides your reality.
Explore vertical routes when they match your business, for example profit tools for SaaS, e-commerce, or hospitality.
SCORE’s small business education resources are another grounded reference for survival, planning, and cash flow basics from a nonprofit mentor network.
Early warning signs (before revenue peaks mask the problem)
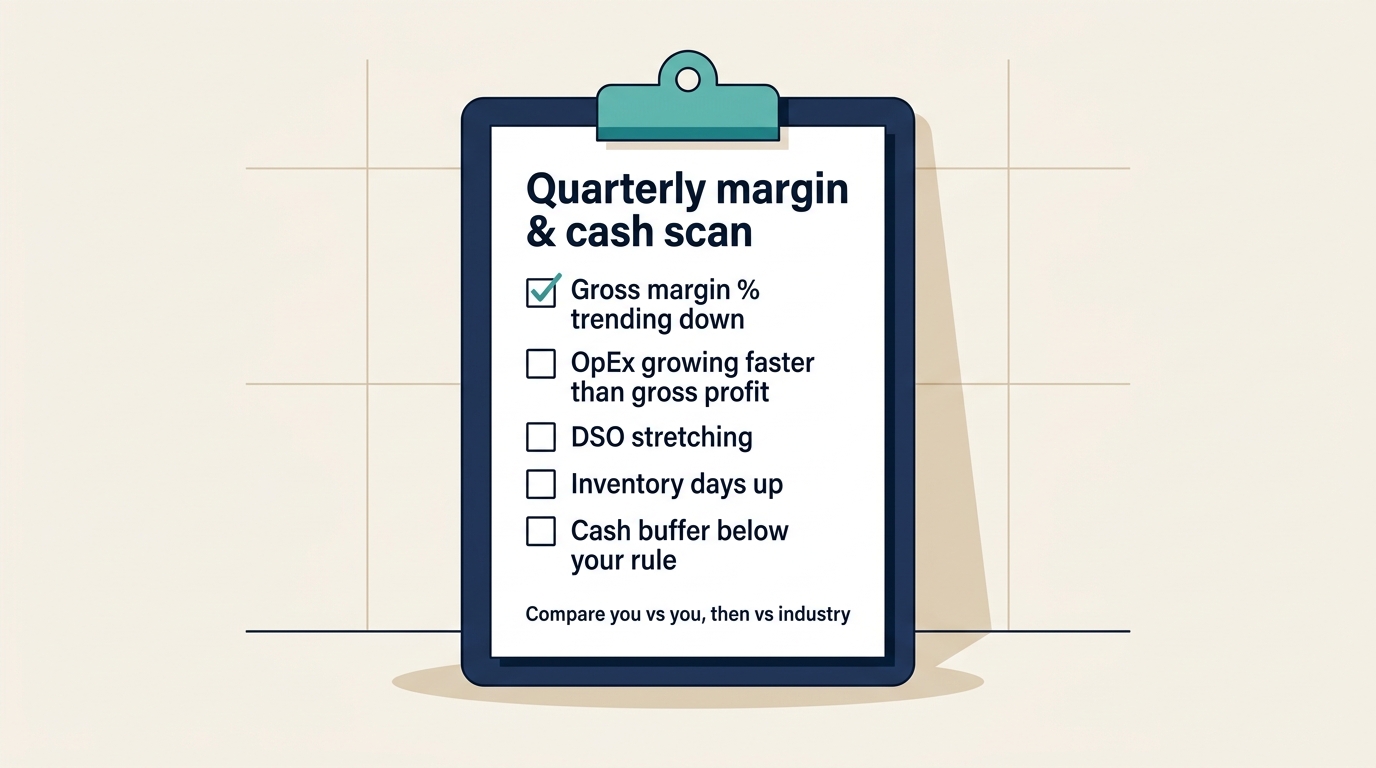
Use this as a quarterly red flag pass, not a one-time exercise.
Gross margin % trends down for three periods while revenue rises (discounting, COGS inflation, or mix shift).
Operating expenses grow faster than gross profit (you are buying complexity without improving contribution per dollar of sales).
DSO (days sales outstanding) climbs or large customers push longer terms.
Inventory days rise in retail, wholesale, or manufacturing without a clear sales plan.
Cash buffer falls below a defined runway (many operators aim for months of fixed costs; pick a number and defend it).
Break-even moves up quietly because lower contribution per order means you need more volume to cover the same rent. For service firms, break-even analysis for service businesses ties capacity and pricing to that line.
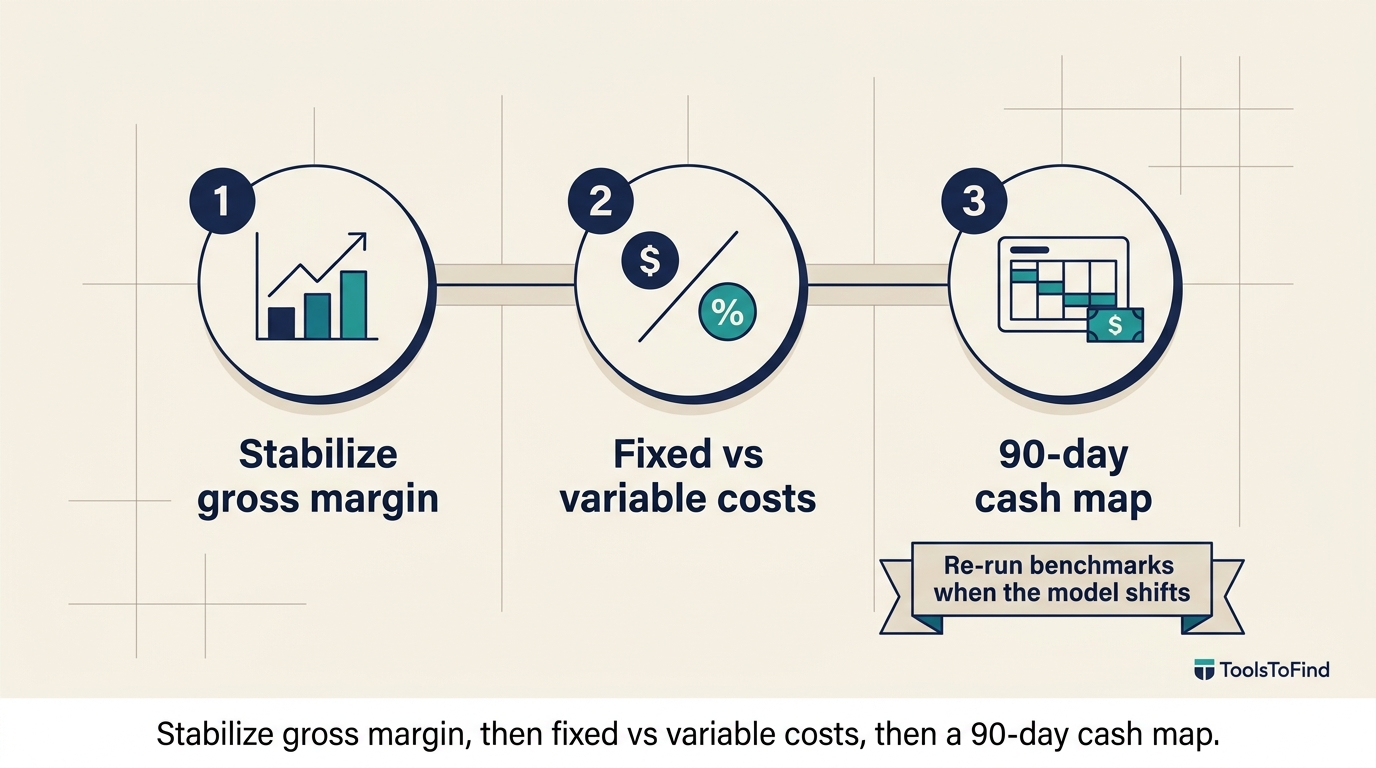
What to do next: margins as a decision tool
1. Stabilize gross margin first. Audit discounts, product mix, supplier costs, and delivery labor leakage. If you cannot defend gross margin, operating fixes are temporary.
2. Review how fixed and variable costs behave. Separate fixed versus variable spend. Know what happens if revenue drops 10%. If the answer is ugly, trim or renegotiate before you are forced to.
3. Pair margin review with a simple cash map. List the next 90 days of must-pay items against realistic inflows. Profitability tools and accounting statements help, but the calendar is the truth test.
4. Re-run benchmarks when your business model shifts. New SKUs, new markets, or new hiring change the margin stack. Save snapshots over time so you compare you to you, not only to benchmarks.
When you want everything in one workspace, start from the tools directory. If you return to margin math monthly, sign in so you can keep saved scenarios on your dashboard instead of re-keying the same inputs.
Questions owners ask in plain language
Can a business fail if it has a lot of revenue? Yes. High revenue low profit is common when margins are thin, costs scale with sales, or cash is tied up in receivables and inventory. Revenue measures activity, not survival.
Why is my business profitable but I have no cash? Accrual profit can include sales you have not collected yet, while payroll and suppliers want cash now. Growth often consumes working capital before new cash comes back. That is the core of cash flow vs profit.
Is gross margin or net margin more important? They answer different questions. Gross margin tests pricing and direct costs. Net margin tests the full business after overhead, interest, and taxes. Fix gross margin first if it is drifting; otherwise you are patching leaks with strategy slides.
Do industry profit margin benchmarks really matter? They turn a percentage into a decision. A margin that feels “fine” in the abstract may be below viable for your sector once risk and capital needs are counted.
Conclusion
Why businesses fail with high revenue is rarely a mystery once you separate sales from margins and cash. Revenue proves demand; gross margin proves the offer is priced and built to survive; operating margin proves the business can run; net margin and cash prove it can last through timing and financing reality.
Pick one date this month to write down revenue, gross margin %, operating margin %, and cash runway. If those four numbers disagree with your gut feeling, trust the math first. Then adjust pricing, cost, or capital before the story you tell yourself about “a great top line” becomes an exit you did not plan.
Your next step: run your actuals through the profit margin calculators, compare to your industry benchmark, and keep the output where you will see it next quarter. Growth feels good; margin and cash decide whether it stays good.
Stay in the loop
Get product updates and editorial highlights. Manage email preferences in your account settings.
Sign in for freeRelated calculators
Use these tools when you want to turn the article guidance into a calculation, estimate, or operating draft.
Ecommerce store profit margin calculator
Include landed cost, shipping, returns, platform fees, markdowns, payment fees, ads, and overhead.
Real estate agency business plan generator
Draft a plan around transaction volume, agent splits, recruiting, lead sources, overhead, and cash timing.
Roofing ROI calculator
Model payback using lead cost, close rate, crew capacity, seasonality, rework, and material pressure.
Plumbing invoice generator
Document service address, diagnosis, labor, parts, emergency fees, warranty notes, and balance due.
More articles

Finance
Profit Margin Insights Every Entrepreneur Must Know to Build a Sustainable Business
What is a good profit margin for a small business? Learn industry-aware benchmarks and practical pricing and cost moves to build sustainable profit.

Finance
Invoice Follow-Up System for Faster Payments
A useful invoice follow-up process reduces days sales outstanding without turning collections into a messy manual scramble.

Strategy
How Hedera Solves Scalability for Business Applications (2026)
How Hedera Solves Scalability for Business Applications (2026) Meta Description: Hedera's hashgraph consensus delivers 10,000+ TPS with 2.9-second finality and fixed low fees. See how the architecture, governance, and real benchmarks solve scalability for enterprise payments, tokenization, supply ch